Dominican vs Immigrants from Greece Currently Married
COMPARE
Dominican
Immigrants from Greece
Currently Married
Currently Married Comparison
Dominicans
Immigrants from Greece
39.5%
CURRENTLY MARRIED
0.0/ 100
METRIC RATING
339th/ 347
METRIC RANK
47.7%
CURRENTLY MARRIED
93.1/ 100
METRIC RATING
106th/ 347
METRIC RANK
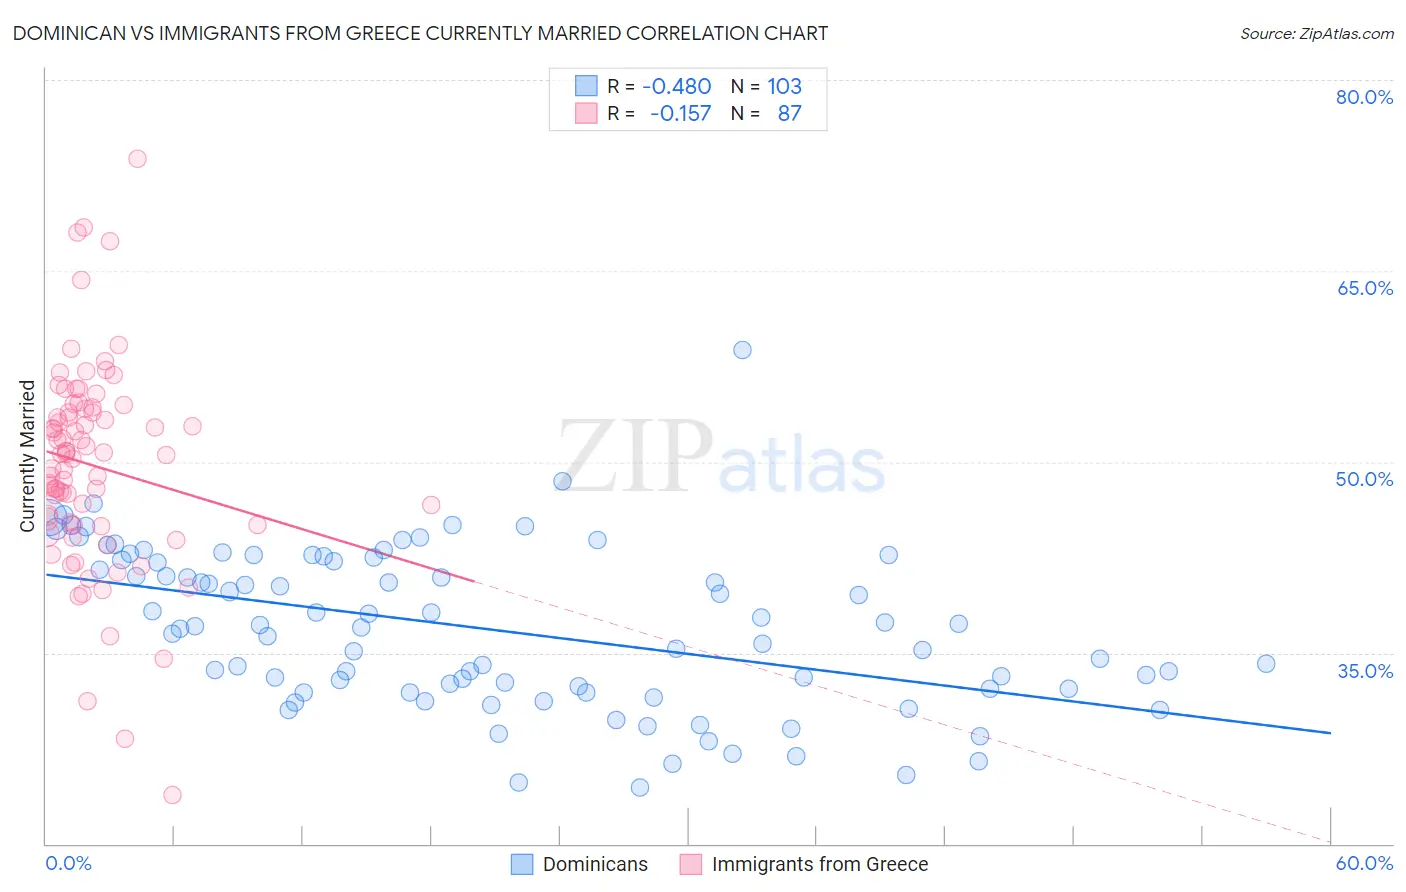
Dominican vs Immigrants from Greece Currently Married Correlation Chart
The statistical analysis conducted on geographies consisting of 355,078,950 people shows a moderate negative correlation between the proportion of Dominicans and percentage of population currently married in the United States with a correlation coefficient (R) of -0.480 and weighted average of 39.5%. Similarly, the statistical analysis conducted on geographies consisting of 216,874,138 people shows a poor negative correlation between the proportion of Immigrants from Greece and percentage of population currently married in the United States with a correlation coefficient (R) of -0.157 and weighted average of 47.7%, a difference of 20.8%.
Currently Married Correlation Summary
| Measurement | Dominican | Immigrants from Greece |
| Minimum | 24.4% | 23.8% |
| Maximum | 58.8% | 73.8% |
| Range | 34.4% | 50.0% |
| Mean | 36.9% | 49.7% |
| Median | 37.0% | 50.6% |
| Interquartile 25% (IQ1) | 32.2% | 45.0% |
| Interquartile 75% (IQ3) | 42.3% | 54.2% |
| Interquartile Range (IQR) | 10.1% | 9.1% |
| Standard Deviation (Sample) | 6.3% | 8.1% |
| Standard Deviation (Population) | 6.2% | 8.1% |
Similar Demographics by Currently Married
Demographics Similar to Dominicans by Currently Married
In terms of currently married, the demographic groups most similar to Dominicans are Cape Verdean (39.6%, a difference of 0.15%), Black/African American (39.6%, a difference of 0.25%), British West Indian (39.8%, a difference of 0.63%), Lumbee (39.8%, a difference of 0.80%), and Immigrants from Grenada (39.1%, a difference of 0.96%).
| Demographics | Rating | Rank | Currently Married |
| Immigrants | St. Vincent and the Grenadines | 0.0 /100 | #332 | Tragic 40.1% |
| Yup'ik | 0.0 /100 | #333 | Tragic 39.9% |
| Puerto Ricans | 0.0 /100 | #334 | Tragic 39.9% |
| Lumbee | 0.0 /100 | #335 | Tragic 39.8% |
| British West Indians | 0.0 /100 | #336 | Tragic 39.8% |
| Blacks/African Americans | 0.0 /100 | #337 | Tragic 39.6% |
| Cape Verdeans | 0.0 /100 | #338 | Tragic 39.6% |
| Dominicans | 0.0 /100 | #339 | Tragic 39.5% |
| Immigrants | Grenada | 0.0 /100 | #340 | Tragic 39.1% |
| Navajo | 0.0 /100 | #341 | Tragic 39.0% |
| Immigrants | Dominican Republic | 0.0 /100 | #342 | Tragic 38.9% |
| Pueblo | 0.0 /100 | #343 | Tragic 38.2% |
| Immigrants | Cabo Verde | 0.0 /100 | #344 | Tragic 37.8% |
| Tohono O'odham | 0.0 /100 | #345 | Tragic 36.8% |
| Hopi | 0.0 /100 | #346 | Tragic 36.5% |
Demographics Similar to Immigrants from Greece by Currently Married
In terms of currently married, the demographic groups most similar to Immigrants from Greece are Immigrants from Singapore (47.8%, a difference of 0.030%), Immigrants from Italy (47.7%, a difference of 0.030%), Serbian (47.8%, a difference of 0.080%), Cypriot (47.8%, a difference of 0.090%), and Tsimshian (47.7%, a difference of 0.090%).
| Demographics | Rating | Rank | Currently Married |
| Immigrants | Sweden | 94.3 /100 | #99 | Exceptional 47.8% |
| Celtics | 94.2 /100 | #100 | Exceptional 47.8% |
| Immigrants | Germany | 94.1 /100 | #101 | Exceptional 47.8% |
| Turks | 93.9 /100 | #102 | Exceptional 47.8% |
| Cypriots | 93.7 /100 | #103 | Exceptional 47.8% |
| Serbians | 93.6 /100 | #104 | Exceptional 47.8% |
| Immigrants | Singapore | 93.3 /100 | #105 | Exceptional 47.8% |
| Immigrants | Greece | 93.1 /100 | #106 | Exceptional 47.7% |
| Immigrants | Italy | 92.9 /100 | #107 | Exceptional 47.7% |
| Tsimshian | 92.4 /100 | #108 | Exceptional 47.7% |
| Immigrants | Egypt | 92.3 /100 | #109 | Exceptional 47.7% |
| Immigrants | Russia | 92.0 /100 | #110 | Exceptional 47.7% |
| Immigrants | Hungary | 91.2 /100 | #111 | Exceptional 47.6% |
| Immigrants | Western Europe | 91.1 /100 | #112 | Exceptional 47.6% |
| Immigrants | Denmark | 90.9 /100 | #113 | Exceptional 47.6% |