Dominican vs Danish Currently Married
COMPARE
Dominican
Danish
Currently Married
Currently Married Comparison
Dominicans
Danes
39.5%
CURRENTLY MARRIED
0.0/ 100
METRIC RATING
339th/ 347
METRIC RANK
50.5%
CURRENTLY MARRIED
100.0/ 100
METRIC RATING
5th/ 347
METRIC RANK
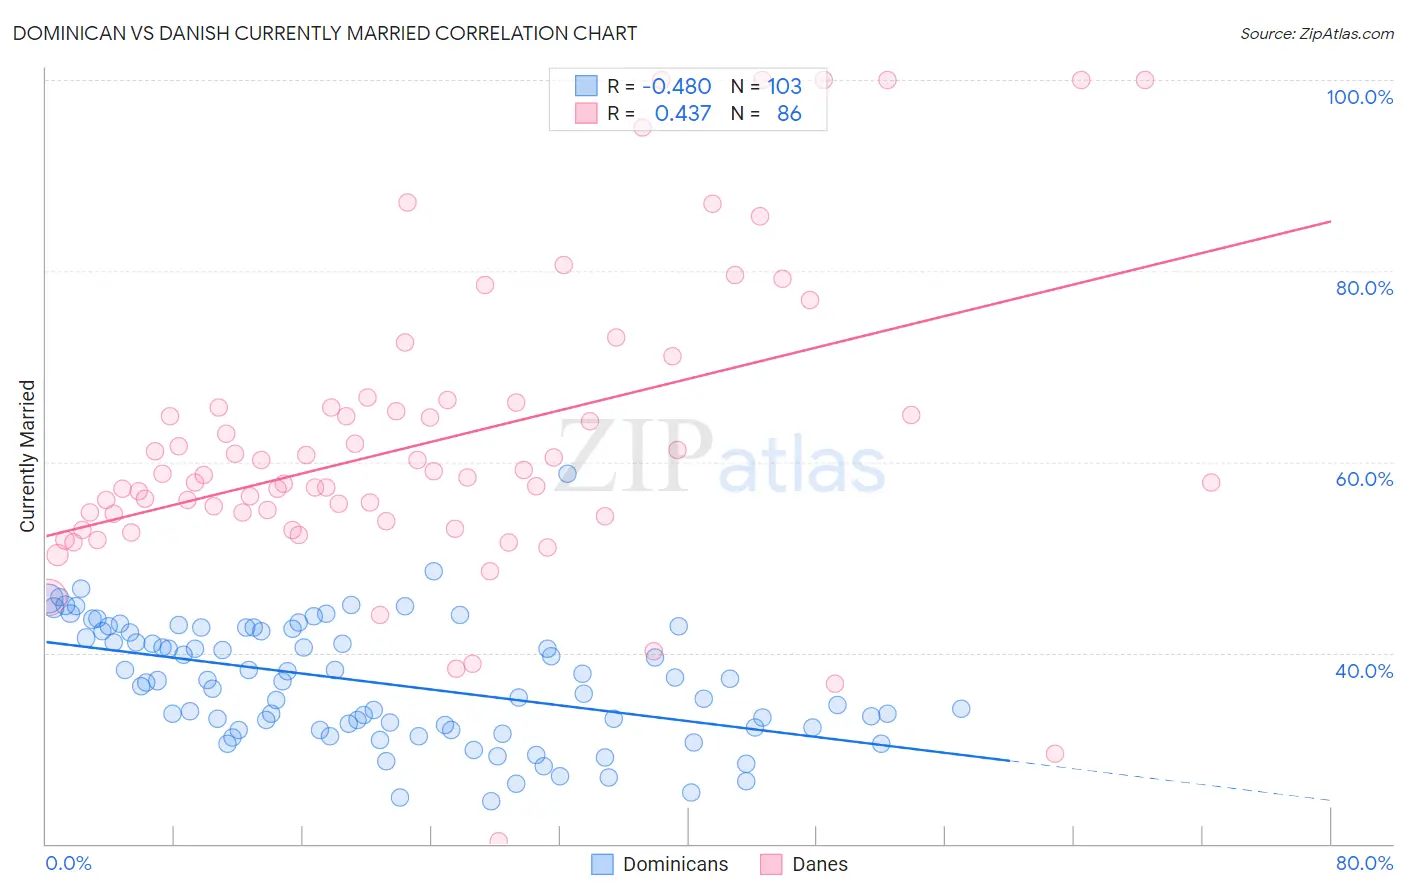
Dominican vs Danish Currently Married Correlation Chart
The statistical analysis conducted on geographies consisting of 355,078,950 people shows a moderate negative correlation between the proportion of Dominicans and percentage of population currently married in the United States with a correlation coefficient (R) of -0.480 and weighted average of 39.5%. Similarly, the statistical analysis conducted on geographies consisting of 474,135,576 people shows a moderate positive correlation between the proportion of Danes and percentage of population currently married in the United States with a correlation coefficient (R) of 0.437 and weighted average of 50.5%, a difference of 27.7%.
Currently Married Correlation Summary
| Measurement | Dominican | Danish |
| Minimum | 24.4% | 20.3% |
| Maximum | 58.8% | 100.0% |
| Range | 34.4% | 79.7% |
| Mean | 36.9% | 62.1% |
| Median | 37.0% | 58.5% |
| Interquartile 25% (IQ1) | 32.2% | 54.3% |
| Interquartile 75% (IQ3) | 42.3% | 65.8% |
| Interquartile Range (IQR) | 10.1% | 11.5% |
| Standard Deviation (Sample) | 6.3% | 15.8% |
| Standard Deviation (Population) | 6.2% | 15.7% |
Similar Demographics by Currently Married
Demographics Similar to Dominicans by Currently Married
In terms of currently married, the demographic groups most similar to Dominicans are Cape Verdean (39.6%, a difference of 0.15%), Black/African American (39.6%, a difference of 0.25%), British West Indian (39.8%, a difference of 0.63%), Lumbee (39.8%, a difference of 0.80%), and Immigrants from Grenada (39.1%, a difference of 0.96%).
| Demographics | Rating | Rank | Currently Married |
| Immigrants | St. Vincent and the Grenadines | 0.0 /100 | #332 | Tragic 40.1% |
| Yup'ik | 0.0 /100 | #333 | Tragic 39.9% |
| Puerto Ricans | 0.0 /100 | #334 | Tragic 39.9% |
| Lumbee | 0.0 /100 | #335 | Tragic 39.8% |
| British West Indians | 0.0 /100 | #336 | Tragic 39.8% |
| Blacks/African Americans | 0.0 /100 | #337 | Tragic 39.6% |
| Cape Verdeans | 0.0 /100 | #338 | Tragic 39.6% |
| Dominicans | 0.0 /100 | #339 | Tragic 39.5% |
| Immigrants | Grenada | 0.0 /100 | #340 | Tragic 39.1% |
| Navajo | 0.0 /100 | #341 | Tragic 39.0% |
| Immigrants | Dominican Republic | 0.0 /100 | #342 | Tragic 38.9% |
| Pueblo | 0.0 /100 | #343 | Tragic 38.2% |
| Immigrants | Cabo Verde | 0.0 /100 | #344 | Tragic 37.8% |
| Tohono O'odham | 0.0 /100 | #345 | Tragic 36.8% |
| Hopi | 0.0 /100 | #346 | Tragic 36.5% |
Demographics Similar to Danes by Currently Married
In terms of currently married, the demographic groups most similar to Danes are Norwegian (50.2%, a difference of 0.54%), Immigrants from Taiwan (50.7%, a difference of 0.55%), Assyrian/Chaldean/Syriac (50.8%, a difference of 0.63%), Thai (50.9%, a difference of 0.81%), and Immigrants from South Central Asia (50.0%, a difference of 0.88%).
| Demographics | Rating | Rank | Currently Married |
| Immigrants | India | 100.0 /100 | #1 | Exceptional 51.8% |
| Thais | 100.0 /100 | #2 | Exceptional 50.9% |
| Assyrians/Chaldeans/Syriacs | 100.0 /100 | #3 | Exceptional 50.8% |
| Immigrants | Taiwan | 100.0 /100 | #4 | Exceptional 50.7% |
| Danes | 100.0 /100 | #5 | Exceptional 50.5% |
| Norwegians | 100.0 /100 | #6 | Exceptional 50.2% |
| Immigrants | South Central Asia | 100.0 /100 | #7 | Exceptional 50.0% |
| Swedes | 100.0 /100 | #8 | Exceptional 50.0% |
| Czechs | 99.9 /100 | #9 | Exceptional 49.9% |
| Filipinos | 99.9 /100 | #10 | Exceptional 49.7% |
| English | 99.9 /100 | #11 | Exceptional 49.7% |
| Swiss | 99.9 /100 | #12 | Exceptional 49.7% |
| Dutch | 99.9 /100 | #13 | Exceptional 49.6% |
| Germans | 99.9 /100 | #14 | Exceptional 49.6% |
| Pennsylvania Germans | 99.9 /100 | #15 | Exceptional 49.6% |