Arab vs Yakama Average Family Size
COMPARE
Arab
Yakama
Average Family Size
Average Family Size Comparison
Arabs
Yakama
3.23
AVERAGE FAMILY SIZE
53.8/ 100
METRIC RATING
170th/ 347
METRIC RANK
3.45
AVERAGE FAMILY SIZE
100.0/ 100
METRIC RATING
25th/ 347
METRIC RANK
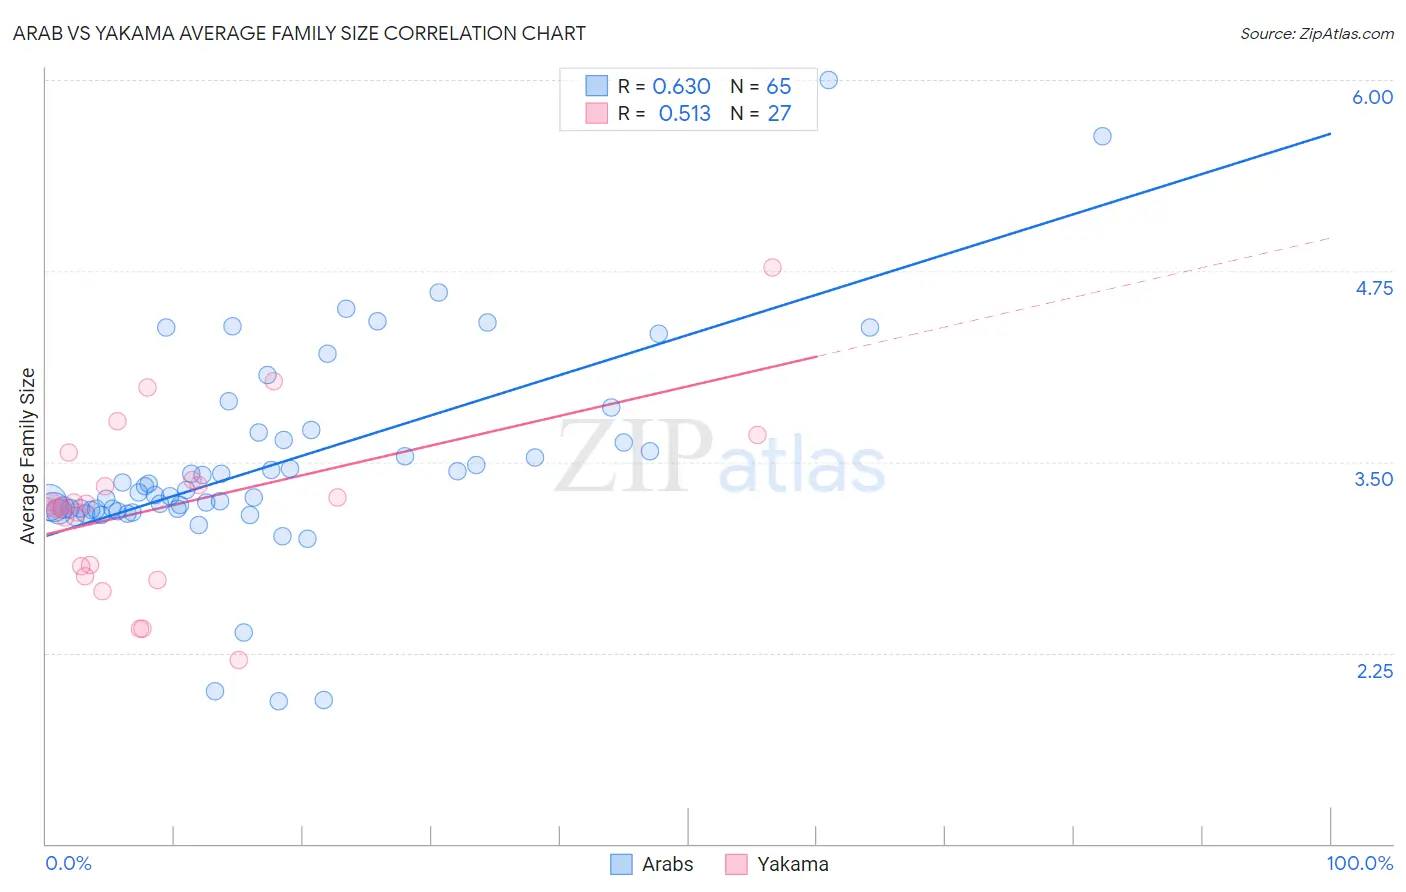
Arab vs Yakama Average Family Size Correlation Chart
The statistical analysis conducted on geographies consisting of 486,389,490 people shows a significant positive correlation between the proportion of Arabs and average family size in the United States with a correlation coefficient (R) of 0.630 and weighted average of 3.23. Similarly, the statistical analysis conducted on geographies consisting of 19,917,879 people shows a substantial positive correlation between the proportion of Yakama and average family size in the United States with a correlation coefficient (R) of 0.513 and weighted average of 3.45, a difference of 6.7%.
Average Family Size Correlation Summary
| Measurement | Arab | Yakama |
| Minimum | 1.93 | 2.20 |
| Maximum | 6.00 | 4.77 |
| Range | 4.07 | 2.57 |
| Mean | 3.49 | 3.21 |
| Median | 3.30 | 3.21 |
| Interquartile 25% (IQ1) | 3.19 | 2.82 |
| Interquartile 75% (IQ3) | 3.67 | 3.38 |
| Interquartile Range (IQR) | 0.48 | 0.56 |
| Standard Deviation (Sample) | 0.69 | 0.55 |
| Standard Deviation (Population) | 0.68 | 0.54 |
Similar Demographics by Average Family Size
Demographics Similar to Arabs by Average Family Size
In terms of average family size, the demographic groups most similar to Arabs are Taiwanese (3.23, a difference of 0.010%), Aleut (3.23, a difference of 0.010%), Chilean (3.23, a difference of 0.010%), Immigrants from Congo (3.23, a difference of 0.020%), and Immigrants from Uruguay (3.23, a difference of 0.030%).
| Demographics | Rating | Rank | Average Family Size |
| Uruguayans | 58.8 /100 | #163 | Average 3.23 |
| Egyptians | 58.6 /100 | #164 | Average 3.23 |
| Ugandans | 58.4 /100 | #165 | Average 3.23 |
| Immigrants | Senegal | 57.5 /100 | #166 | Average 3.23 |
| Dutch West Indians | 56.9 /100 | #167 | Average 3.23 |
| Taiwanese | 54.2 /100 | #168 | Average 3.23 |
| Aleuts | 54.1 /100 | #169 | Average 3.23 |
| Arabs | 53.8 /100 | #170 | Average 3.23 |
| Chileans | 53.2 /100 | #171 | Average 3.23 |
| Immigrants | Congo | 52.7 /100 | #172 | Average 3.23 |
| Immigrants | Uruguay | 52.0 /100 | #173 | Average 3.23 |
| Immigrants | South Central Asia | 50.0 /100 | #174 | Average 3.23 |
| Immigrants | China | 49.9 /100 | #175 | Average 3.23 |
| Israelis | 48.7 /100 | #176 | Average 3.23 |
| Argentineans | 47.4 /100 | #177 | Average 3.23 |
Demographics Similar to Yakama by Average Family Size
In terms of average family size, the demographic groups most similar to Yakama are Native/Alaskan (3.45, a difference of 0.11%), Immigrants from Fiji (3.45, a difference of 0.23%), Native Hawaiian (3.43, a difference of 0.51%), Apache (3.46, a difference of 0.52%), and Mexican American Indian (3.43, a difference of 0.52%).
| Demographics | Rating | Rank | Average Family Size |
| Salvadorans | 100.0 /100 | #18 | Exceptional 3.48 |
| Mexicans | 100.0 /100 | #19 | Exceptional 3.48 |
| Cheyenne | 100.0 /100 | #20 | Exceptional 3.47 |
| Yuman | 100.0 /100 | #21 | Exceptional 3.47 |
| Apache | 100.0 /100 | #22 | Exceptional 3.46 |
| Immigrants | Fiji | 100.0 /100 | #23 | Exceptional 3.45 |
| Natives/Alaskans | 100.0 /100 | #24 | Exceptional 3.45 |
| Yakama | 100.0 /100 | #25 | Exceptional 3.45 |
| Native Hawaiians | 100.0 /100 | #26 | Exceptional 3.43 |
| Mexican American Indians | 100.0 /100 | #27 | Exceptional 3.43 |
| Immigrants | Latin America | 100.0 /100 | #28 | Exceptional 3.42 |
| Nepalese | 100.0 /100 | #29 | Exceptional 3.42 |
| Samoans | 100.0 /100 | #30 | Exceptional 3.42 |
| Central Americans | 100.0 /100 | #31 | Exceptional 3.41 |
| Immigrants | Guatemala | 100.0 /100 | #32 | Exceptional 3.41 |