Hispanic or Latino vs Palestinian Average Family Size
COMPARE
Hispanic or Latino
Palestinian
Average Family Size
Average Family Size Comparison
Hispanics or Latinos
Palestinians
3.41
AVERAGE FAMILY SIZE
100.0/ 100
METRIC RATING
34th/ 347
METRIC RANK
3.23
AVERAGE FAMILY SIZE
46.6/ 100
METRIC RATING
180th/ 347
METRIC RANK
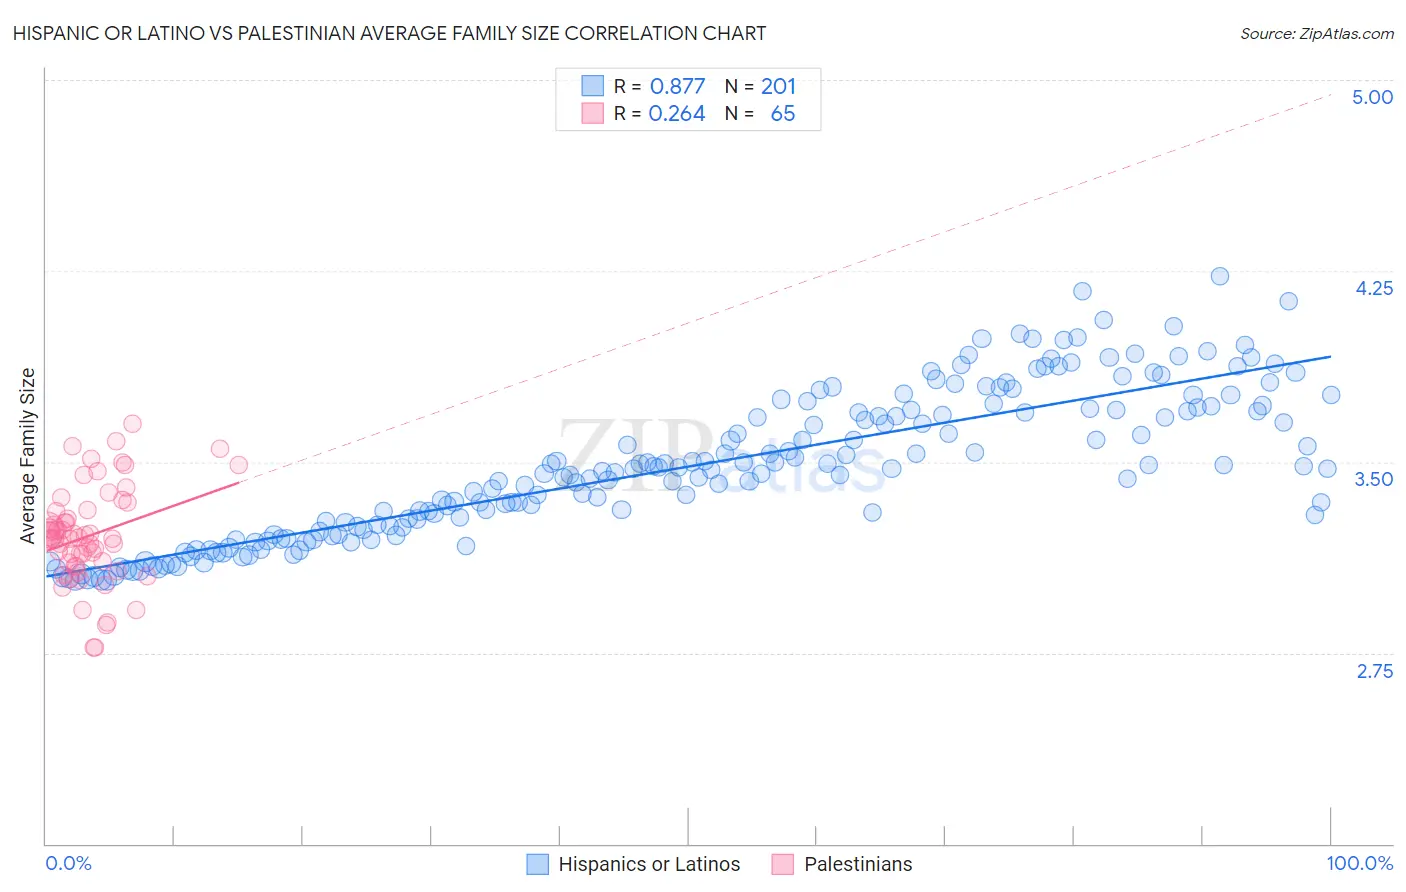
Hispanic or Latino vs Palestinian Average Family Size Correlation Chart
The statistical analysis conducted on geographies consisting of 577,913,054 people shows a very strong positive correlation between the proportion of Hispanics or Latinos and average family size in the United States with a correlation coefficient (R) of 0.877 and weighted average of 3.41. Similarly, the statistical analysis conducted on geographies consisting of 216,402,658 people shows a weak positive correlation between the proportion of Palestinians and average family size in the United States with a correlation coefficient (R) of 0.264 and weighted average of 3.23, a difference of 5.6%.
Average Family Size Correlation Summary
| Measurement | Hispanic or Latino | Palestinian |
| Minimum | 3.03 | 2.77 |
| Maximum | 4.23 | 3.65 |
| Range | 1.20 | 0.88 |
| Mean | 3.48 | 3.21 |
| Median | 3.47 | 3.20 |
| Interquartile 25% (IQ1) | 3.24 | 3.10 |
| Interquartile 75% (IQ3) | 3.71 | 3.31 |
| Interquartile Range (IQR) | 0.47 | 0.21 |
| Standard Deviation (Sample) | 0.29 | 0.19 |
| Standard Deviation (Population) | 0.29 | 0.19 |
Similar Demographics by Average Family Size
Demographics Similar to Hispanics or Latinos by Average Family Size
In terms of average family size, the demographic groups most similar to Hispanics or Latinos are Hawaiian (3.41, a difference of 0.050%), Guatemalan (3.40, a difference of 0.060%), Immigrants from Guatemala (3.41, a difference of 0.080%), Immigrants from Guyana (3.40, a difference of 0.11%), and Central American (3.41, a difference of 0.18%).
| Demographics | Rating | Rank | Average Family Size |
| Mexican American Indians | 100.0 /100 | #27 | Exceptional 3.43 |
| Immigrants | Latin America | 100.0 /100 | #28 | Exceptional 3.42 |
| Nepalese | 100.0 /100 | #29 | Exceptional 3.42 |
| Samoans | 100.0 /100 | #30 | Exceptional 3.42 |
| Central Americans | 100.0 /100 | #31 | Exceptional 3.41 |
| Immigrants | Guatemala | 100.0 /100 | #32 | Exceptional 3.41 |
| Hawaiians | 100.0 /100 | #33 | Exceptional 3.41 |
| Hispanics or Latinos | 100.0 /100 | #34 | Exceptional 3.41 |
| Guatemalans | 100.0 /100 | #35 | Exceptional 3.40 |
| Immigrants | Guyana | 100.0 /100 | #36 | Exceptional 3.40 |
| Guyanese | 100.0 /100 | #37 | Exceptional 3.40 |
| Immigrants | Belize | 100.0 /100 | #38 | Exceptional 3.39 |
| Immigrants | Haiti | 100.0 /100 | #39 | Exceptional 3.39 |
| Belizeans | 100.0 /100 | #40 | Exceptional 3.39 |
| Marshallese | 100.0 /100 | #41 | Exceptional 3.38 |
Demographics Similar to Palestinians by Average Family Size
In terms of average family size, the demographic groups most similar to Palestinians are Argentinean (3.23, a difference of 0.010%), Spaniard (3.23, a difference of 0.010%), Immigrants from Korea (3.23, a difference of 0.010%), Spanish (3.23, a difference of 0.030%), and Israeli (3.23, a difference of 0.040%).
| Demographics | Rating | Rank | Average Family Size |
| Immigrants | Uruguay | 52.0 /100 | #173 | Average 3.23 |
| Immigrants | South Central Asia | 50.0 /100 | #174 | Average 3.23 |
| Immigrants | China | 49.9 /100 | #175 | Average 3.23 |
| Israelis | 48.7 /100 | #176 | Average 3.23 |
| Argentineans | 47.4 /100 | #177 | Average 3.23 |
| Spaniards | 47.2 /100 | #178 | Average 3.23 |
| Immigrants | Korea | 46.9 /100 | #179 | Average 3.23 |
| Palestinians | 46.6 /100 | #180 | Average 3.23 |
| Spanish | 44.8 /100 | #181 | Average 3.23 |
| Moroccans | 44.2 /100 | #182 | Average 3.22 |
| Immigrants | Northern Africa | 41.7 /100 | #183 | Average 3.22 |
| Immigrants | Eastern Asia | 40.8 /100 | #184 | Average 3.22 |
| Immigrants | Sri Lanka | 39.8 /100 | #185 | Fair 3.22 |
| Immigrants | Argentina | 39.8 /100 | #186 | Fair 3.22 |
| Immigrants | Malaysia | 39.0 /100 | #187 | Fair 3.22 |