Immigrants from Central America vs Palestinian Average Family Size
COMPARE
Immigrants from Central America
Palestinian
Average Family Size
Average Family Size Comparison
Immigrants from Central America
Palestinians
3.49
AVERAGE FAMILY SIZE
100.0/ 100
METRIC RATING
14th/ 347
METRIC RANK
3.23
AVERAGE FAMILY SIZE
46.6/ 100
METRIC RATING
180th/ 347
METRIC RANK
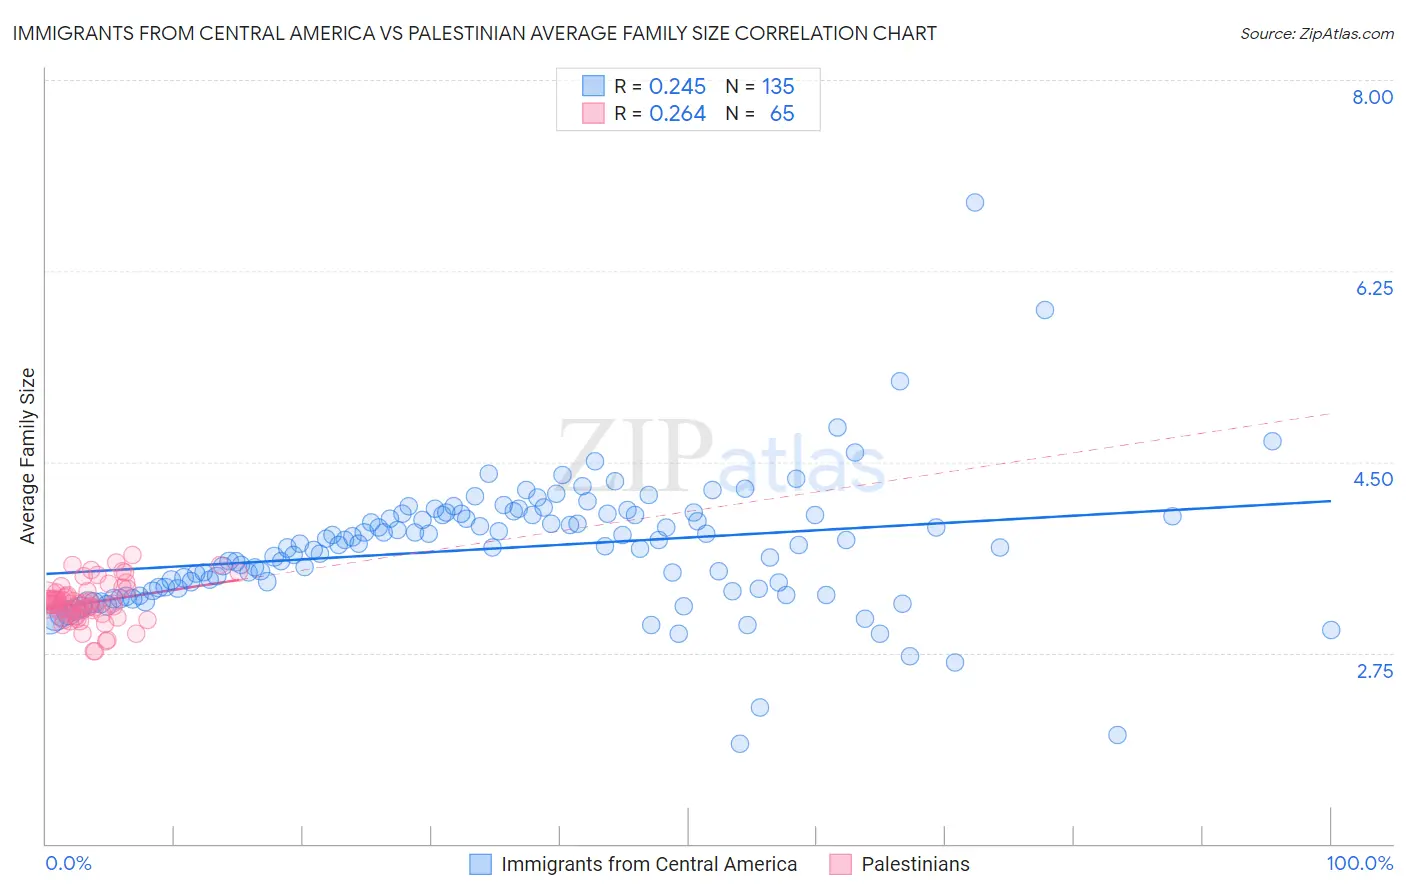
Immigrants from Central America vs Palestinian Average Family Size Correlation Chart
The statistical analysis conducted on geographies consisting of 536,085,955 people shows a weak positive correlation between the proportion of Immigrants from Central America and average family size in the United States with a correlation coefficient (R) of 0.245 and weighted average of 3.49. Similarly, the statistical analysis conducted on geographies consisting of 216,402,658 people shows a weak positive correlation between the proportion of Palestinians and average family size in the United States with a correlation coefficient (R) of 0.264 and weighted average of 3.23, a difference of 8.3%.
Average Family Size Correlation Summary
| Measurement | Immigrants from Central America | Palestinian |
| Minimum | 1.92 | 2.77 |
| Maximum | 6.88 | 3.65 |
| Range | 4.96 | 0.88 |
| Mean | 3.71 | 3.21 |
| Median | 3.74 | 3.20 |
| Interquartile 25% (IQ1) | 3.34 | 3.10 |
| Interquartile 75% (IQ3) | 4.02 | 3.31 |
| Interquartile Range (IQR) | 0.68 | 0.21 |
| Standard Deviation (Sample) | 0.60 | 0.19 |
| Standard Deviation (Population) | 0.60 | 0.19 |
Similar Demographics by Average Family Size
Demographics Similar to Immigrants from Central America by Average Family Size
In terms of average family size, the demographic groups most similar to Immigrants from Central America are Tongan (3.49, a difference of 0.050%), Ute (3.49, a difference of 0.11%), Immigrants from El Salvador (3.49, a difference of 0.19%), Salvadoran (3.48, a difference of 0.44%), and Mexican (3.48, a difference of 0.51%).
| Demographics | Rating | Rank | Average Family Size |
| Inupiat | 100.0 /100 | #7 | Exceptional 3.63 |
| Immigrants | Yemen | 100.0 /100 | #8 | Exceptional 3.60 |
| Hopi | 100.0 /100 | #9 | Exceptional 3.60 |
| Spanish American Indians | 100.0 /100 | #10 | Exceptional 3.58 |
| Tohono O'odham | 100.0 /100 | #11 | Exceptional 3.53 |
| Immigrants | Mexico | 100.0 /100 | #12 | Exceptional 3.52 |
| Sioux | 100.0 /100 | #13 | Exceptional 3.52 |
| Immigrants | Central America | 100.0 /100 | #14 | Exceptional 3.49 |
| Tongans | 100.0 /100 | #15 | Exceptional 3.49 |
| Ute | 100.0 /100 | #16 | Exceptional 3.49 |
| Immigrants | El Salvador | 100.0 /100 | #17 | Exceptional 3.49 |
| Salvadorans | 100.0 /100 | #18 | Exceptional 3.48 |
| Mexicans | 100.0 /100 | #19 | Exceptional 3.48 |
| Cheyenne | 100.0 /100 | #20 | Exceptional 3.47 |
| Yuman | 100.0 /100 | #21 | Exceptional 3.47 |
Demographics Similar to Palestinians by Average Family Size
In terms of average family size, the demographic groups most similar to Palestinians are Argentinean (3.23, a difference of 0.010%), Spaniard (3.23, a difference of 0.010%), Immigrants from Korea (3.23, a difference of 0.010%), Spanish (3.23, a difference of 0.030%), and Israeli (3.23, a difference of 0.040%).
| Demographics | Rating | Rank | Average Family Size |
| Immigrants | Uruguay | 52.0 /100 | #173 | Average 3.23 |
| Immigrants | South Central Asia | 50.0 /100 | #174 | Average 3.23 |
| Immigrants | China | 49.9 /100 | #175 | Average 3.23 |
| Israelis | 48.7 /100 | #176 | Average 3.23 |
| Argentineans | 47.4 /100 | #177 | Average 3.23 |
| Spaniards | 47.2 /100 | #178 | Average 3.23 |
| Immigrants | Korea | 46.9 /100 | #179 | Average 3.23 |
| Palestinians | 46.6 /100 | #180 | Average 3.23 |
| Spanish | 44.8 /100 | #181 | Average 3.23 |
| Moroccans | 44.2 /100 | #182 | Average 3.22 |
| Immigrants | Northern Africa | 41.7 /100 | #183 | Average 3.22 |
| Immigrants | Eastern Asia | 40.8 /100 | #184 | Average 3.22 |
| Immigrants | Sri Lanka | 39.8 /100 | #185 | Fair 3.22 |
| Immigrants | Argentina | 39.8 /100 | #186 | Fair 3.22 |
| Immigrants | Malaysia | 39.0 /100 | #187 | Fair 3.22 |