Delaware vs Immigrants from Senegal 2 or more Vehicles in Household
COMPARE
Delaware
Immigrants from Senegal
2 or more Vehicles in Household
2 or more Vehicles in Household Comparison
Delaware
Immigrants from Senegal
58.2%
2 OR MORE VEHICLES IN HOUSEHOLD
99.4/ 100
METRIC RATING
79th/ 347
METRIC RANK
43.0%
2 OR MORE VEHICLES IN HOUSEHOLD
0.0/ 100
METRIC RATING
326th/ 347
METRIC RANK
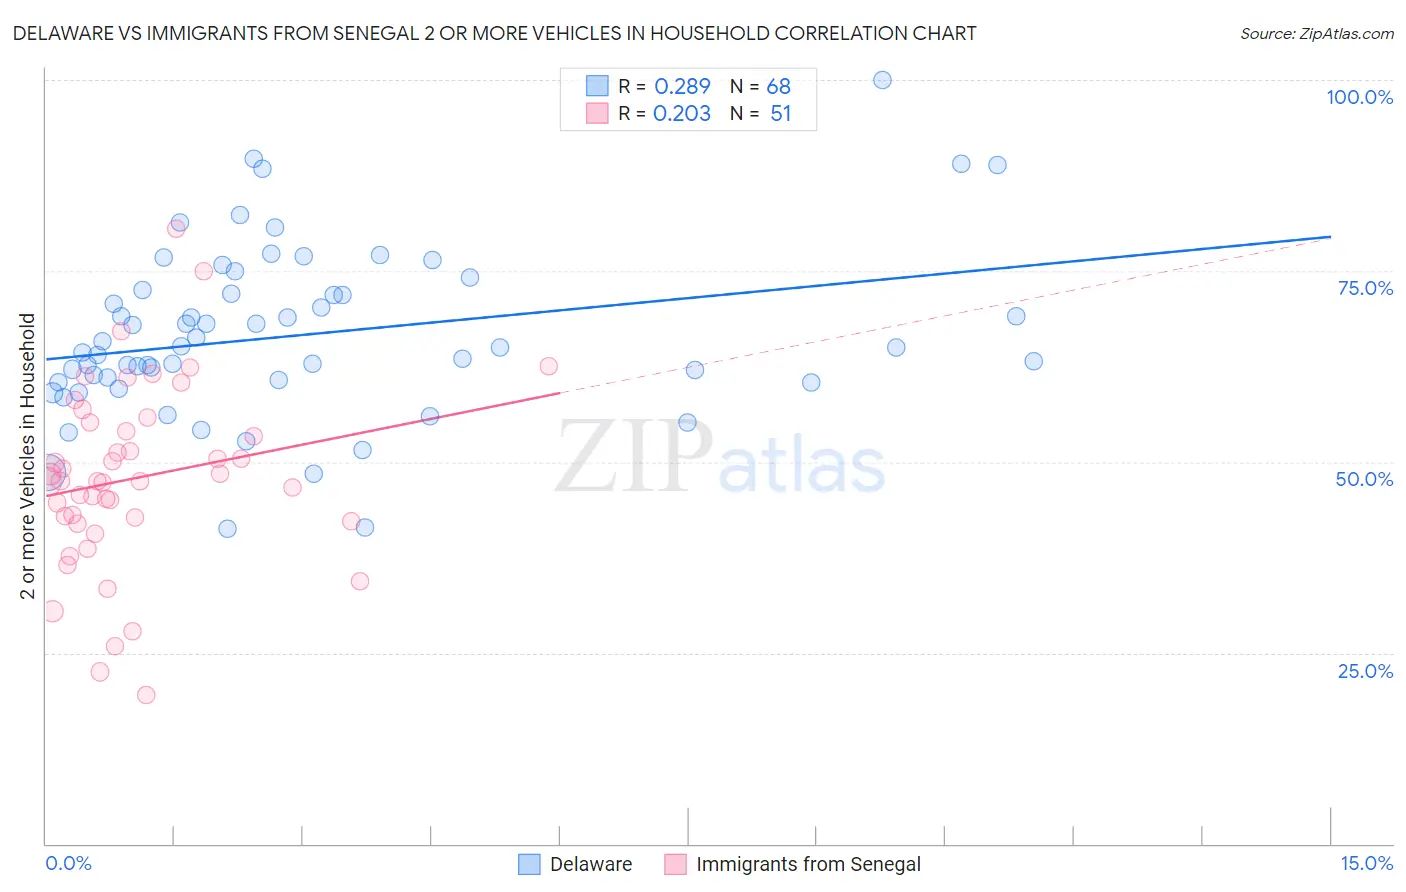
Delaware vs Immigrants from Senegal 2 or more Vehicles in Household Correlation Chart
The statistical analysis conducted on geographies consisting of 96,233,255 people shows a weak positive correlation between the proportion of Delaware and percentage of households with 2 or more vehicles available in the United States with a correlation coefficient (R) of 0.289 and weighted average of 58.2%. Similarly, the statistical analysis conducted on geographies consisting of 90,124,695 people shows a weak positive correlation between the proportion of Immigrants from Senegal and percentage of households with 2 or more vehicles available in the United States with a correlation coefficient (R) of 0.203 and weighted average of 43.0%, a difference of 35.3%.
2 or more Vehicles in Household Correlation Summary
| Measurement | Delaware | Immigrants from Senegal |
| Minimum | 41.2% | 19.5% |
| Maximum | 100.0% | 80.4% |
| Range | 58.8% | 61.0% |
| Mean | 66.6% | 47.9% |
| Median | 65.0% | 47.5% |
| Interquartile 25% (IQ1) | 60.5% | 42.3% |
| Interquartile 75% (IQ3) | 72.2% | 55.2% |
| Interquartile Range (IQR) | 11.7% | 12.9% |
| Standard Deviation (Sample) | 11.1% | 12.1% |
| Standard Deviation (Population) | 11.1% | 12.0% |
Similar Demographics by 2 or more Vehicles in Household
Demographics Similar to Delaware by 2 or more Vehicles in Household
In terms of 2 or more vehicles in household, the demographic groups most similar to Delaware are Lithuanian (58.2%, a difference of 0.080%), Slovene (58.3%, a difference of 0.13%), Creek (58.3%, a difference of 0.14%), Immigrants from England (58.1%, a difference of 0.14%), and Immigrants from Iraq (58.1%, a difference of 0.16%).
| Demographics | Rating | Rank | 2 or more Vehicles in Household |
| Austrians | 99.6 /100 | #72 | Exceptional 58.4% |
| Bolivians | 99.6 /100 | #73 | Exceptional 58.3% |
| Immigrants | Afghanistan | 99.6 /100 | #74 | Exceptional 58.3% |
| Poles | 99.5 /100 | #75 | Exceptional 58.3% |
| Creek | 99.5 /100 | #76 | Exceptional 58.3% |
| Slovenes | 99.5 /100 | #77 | Exceptional 58.3% |
| Lithuanians | 99.5 /100 | #78 | Exceptional 58.2% |
| Delaware | 99.4 /100 | #79 | Exceptional 58.2% |
| Immigrants | England | 99.3 /100 | #80 | Exceptional 58.1% |
| Immigrants | Iraq | 99.3 /100 | #81 | Exceptional 58.1% |
| Iranians | 99.3 /100 | #82 | Exceptional 58.1% |
| Icelanders | 99.2 /100 | #83 | Exceptional 58.0% |
| Maltese | 99.2 /100 | #84 | Exceptional 58.0% |
| Slovaks | 99.2 /100 | #85 | Exceptional 58.0% |
| Potawatomi | 99.1 /100 | #86 | Exceptional 58.0% |
Demographics Similar to Immigrants from Senegal by 2 or more Vehicles in Household
In terms of 2 or more vehicles in household, the demographic groups most similar to Immigrants from Senegal are Immigrants from West Indies (43.1%, a difference of 0.15%), Immigrants from Yemen (42.8%, a difference of 0.41%), Immigrants from Cabo Verde (43.3%, a difference of 0.72%), Inupiat (42.6%, a difference of 0.91%), and Ecuadorian (42.0%, a difference of 2.5%).
| Demographics | Rating | Rank | 2 or more Vehicles in Household |
| Jamaicans | 0.0 /100 | #319 | Tragic 45.8% |
| Soviet Union | 0.0 /100 | #320 | Tragic 45.7% |
| Immigrants | Jamaica | 0.0 /100 | #321 | Tragic 44.5% |
| Senegalese | 0.0 /100 | #322 | Tragic 44.2% |
| Immigrants | Caribbean | 0.0 /100 | #323 | Tragic 44.2% |
| Immigrants | Cabo Verde | 0.0 /100 | #324 | Tragic 43.3% |
| Immigrants | West Indies | 0.0 /100 | #325 | Tragic 43.1% |
| Immigrants | Senegal | 0.0 /100 | #326 | Tragic 43.0% |
| Immigrants | Yemen | 0.0 /100 | #327 | Tragic 42.8% |
| Inupiat | 0.0 /100 | #328 | Tragic 42.6% |
| Ecuadorians | 0.0 /100 | #329 | Tragic 42.0% |
| Immigrants | Dominica | 0.0 /100 | #330 | Tragic 41.6% |
| West Indians | 0.0 /100 | #331 | Tragic 41.3% |
| Trinidadians and Tobagonians | 0.0 /100 | #332 | Tragic 40.9% |
| Immigrants | Ecuador | 0.0 /100 | #333 | Tragic 40.5% |