Afghan vs Immigrants from Nepal Average Family Size
COMPARE
Afghan
Immigrants from Nepal
Average Family Size
Average Family Size Comparison
Afghans
Immigrants from Nepal
3.31
AVERAGE FAMILY SIZE
99.7/ 100
METRIC RATING
85th/ 347
METRIC RANK
3.21
AVERAGE FAMILY SIZE
18.1/ 100
METRIC RATING
203rd/ 347
METRIC RANK
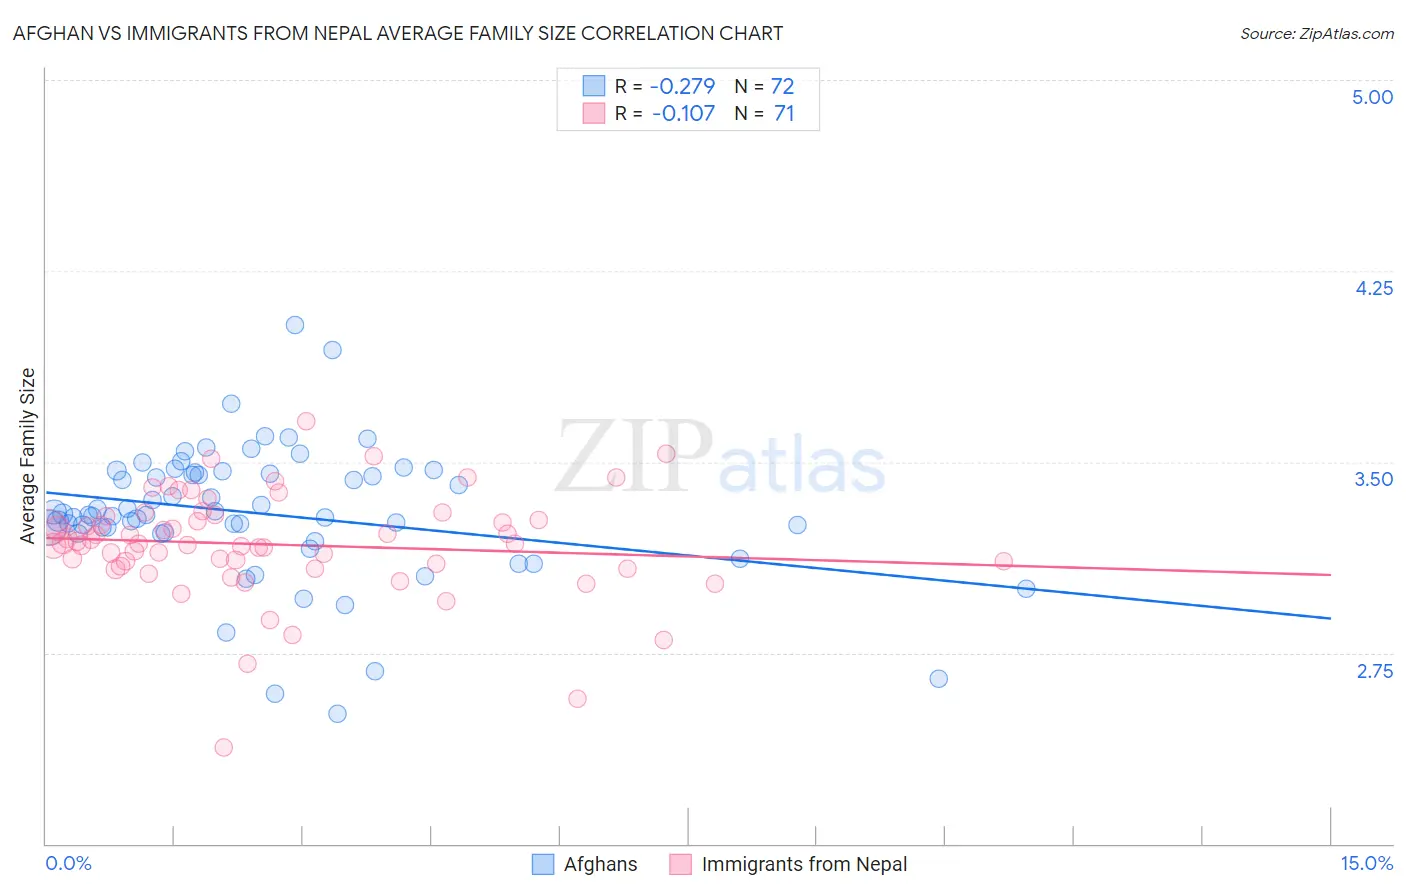
Afghan vs Immigrants from Nepal Average Family Size Correlation Chart
The statistical analysis conducted on geographies consisting of 148,832,546 people shows a weak negative correlation between the proportion of Afghans and average family size in the United States with a correlation coefficient (R) of -0.279 and weighted average of 3.31. Similarly, the statistical analysis conducted on geographies consisting of 186,665,841 people shows a poor negative correlation between the proportion of Immigrants from Nepal and average family size in the United States with a correlation coefficient (R) of -0.107 and weighted average of 3.21, a difference of 3.4%.
Average Family Size Correlation Summary
| Measurement | Afghan | Immigrants from Nepal |
| Minimum | 2.51 | 2.38 |
| Maximum | 4.04 | 3.66 |
| Range | 1.53 | 1.28 |
| Mean | 3.30 | 3.18 |
| Median | 3.29 | 3.18 |
| Interquartile 25% (IQ1) | 3.22 | 3.09 |
| Interquartile 75% (IQ3) | 3.46 | 3.29 |
| Interquartile Range (IQR) | 0.23 | 0.19 |
| Standard Deviation (Sample) | 0.26 | 0.21 |
| Standard Deviation (Population) | 0.26 | 0.21 |
Similar Demographics by Average Family Size
Demographics Similar to Afghans by Average Family Size
In terms of average family size, the demographic groups most similar to Afghans are Jamaican (3.31, a difference of 0.020%), Immigrants from Nigeria (3.32, a difference of 0.040%), Immigrants from Peru (3.31, a difference of 0.070%), Immigrants from Afghanistan (3.32, a difference of 0.080%), and Ecuadorian (3.32, a difference of 0.090%).
| Demographics | Rating | Rank | Average Family Size |
| Immigrants | Micronesia | 99.8 /100 | #78 | Exceptional 3.32 |
| British West Indians | 99.8 /100 | #79 | Exceptional 3.32 |
| Lumbee | 99.8 /100 | #80 | Exceptional 3.32 |
| Immigrants | Dominica | 99.8 /100 | #81 | Exceptional 3.32 |
| Ecuadorians | 99.8 /100 | #82 | Exceptional 3.32 |
| Immigrants | Afghanistan | 99.8 /100 | #83 | Exceptional 3.32 |
| Immigrants | Nigeria | 99.7 /100 | #84 | Exceptional 3.32 |
| Afghans | 99.7 /100 | #85 | Exceptional 3.31 |
| Jamaicans | 99.7 /100 | #86 | Exceptional 3.31 |
| Immigrants | Peru | 99.7 /100 | #87 | Exceptional 3.31 |
| Immigrants | Bolivia | 99.6 /100 | #88 | Exceptional 3.31 |
| Malaysians | 99.6 /100 | #89 | Exceptional 3.31 |
| Menominee | 99.4 /100 | #90 | Exceptional 3.30 |
| Immigrants | Pakistan | 99.2 /100 | #91 | Exceptional 3.30 |
| Immigrants | Cameroon | 99.2 /100 | #92 | Exceptional 3.30 |
Demographics Similar to Immigrants from Nepal by Average Family Size
In terms of average family size, the demographic groups most similar to Immigrants from Nepal are Immigrants from Morocco (3.21, a difference of 0.010%), Immigrants from India (3.21, a difference of 0.010%), Immigrants from Kenya (3.21, a difference of 0.030%), Immigrants from Poland (3.20, a difference of 0.050%), and Paraguayan (3.20, a difference of 0.060%).
| Demographics | Rating | Rank | Average Family Size |
| Senegalese | 28.2 /100 | #196 | Fair 3.21 |
| Kenyans | 28.0 /100 | #197 | Fair 3.21 |
| Immigrants | Azores | 21.7 /100 | #198 | Fair 3.21 |
| Hmong | 20.7 /100 | #199 | Fair 3.21 |
| Immigrants | Kenya | 19.2 /100 | #200 | Poor 3.21 |
| Immigrants | Morocco | 18.5 /100 | #201 | Poor 3.21 |
| Immigrants | India | 18.5 /100 | #202 | Poor 3.21 |
| Immigrants | Nepal | 18.1 /100 | #203 | Poor 3.21 |
| Immigrants | Poland | 16.6 /100 | #204 | Poor 3.20 |
| Paraguayans | 16.3 /100 | #205 | Poor 3.20 |
| Immigrants | Cabo Verde | 16.0 /100 | #206 | Poor 3.20 |
| Filipinos | 13.6 /100 | #207 | Poor 3.20 |
| Chippewa | 13.3 /100 | #208 | Poor 3.20 |
| Sudanese | 13.3 /100 | #209 | Poor 3.20 |
| Zimbabweans | 12.6 /100 | #210 | Poor 3.20 |