Alaska Native vs Immigrants from Nepal Average Family Size
COMPARE
Alaska Native
Immigrants from Nepal
Average Family Size
Average Family Size Comparison
Alaska Natives
Immigrants from Nepal
3.37
AVERAGE FAMILY SIZE
100.0/ 100
METRIC RATING
44th/ 347
METRIC RANK
3.21
AVERAGE FAMILY SIZE
18.1/ 100
METRIC RATING
203rd/ 347
METRIC RANK
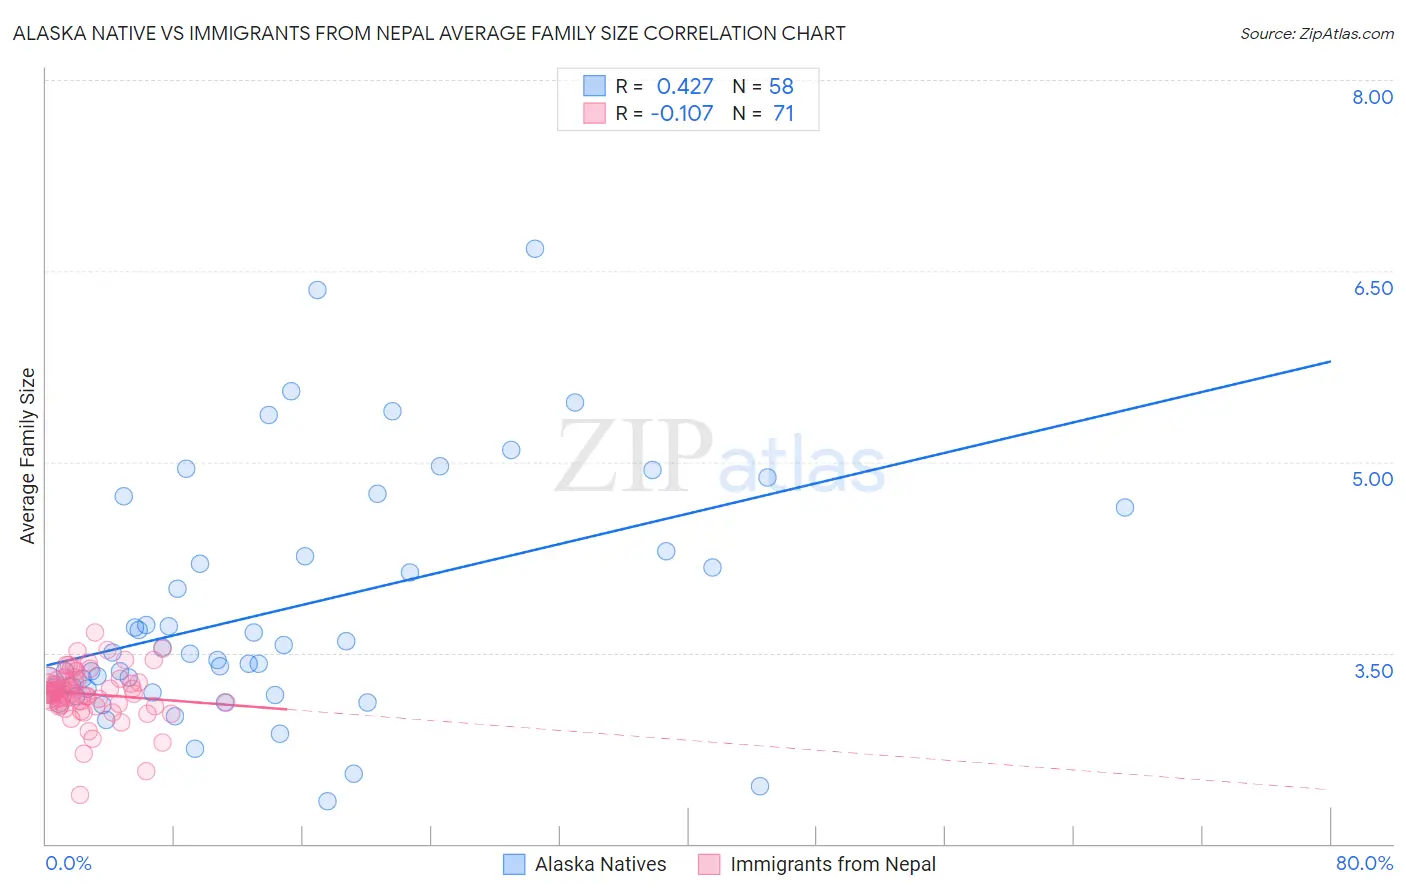
Alaska Native vs Immigrants from Nepal Average Family Size Correlation Chart
The statistical analysis conducted on geographies consisting of 76,756,389 people shows a moderate positive correlation between the proportion of Alaska Natives and average family size in the United States with a correlation coefficient (R) of 0.427 and weighted average of 3.37. Similarly, the statistical analysis conducted on geographies consisting of 186,665,841 people shows a poor negative correlation between the proportion of Immigrants from Nepal and average family size in the United States with a correlation coefficient (R) of -0.107 and weighted average of 3.21, a difference of 5.3%.
Average Family Size Correlation Summary
| Measurement | Alaska Native | Immigrants from Nepal |
| Minimum | 2.33 | 2.38 |
| Maximum | 6.67 | 3.66 |
| Range | 4.34 | 1.28 |
| Mean | 3.83 | 3.18 |
| Median | 3.50 | 3.18 |
| Interquartile 25% (IQ1) | 3.22 | 3.09 |
| Interquartile 75% (IQ3) | 4.30 | 3.29 |
| Interquartile Range (IQR) | 1.08 | 0.19 |
| Standard Deviation (Sample) | 0.95 | 0.21 |
| Standard Deviation (Population) | 0.94 | 0.21 |
Similar Demographics by Average Family Size
Demographics Similar to Alaska Natives by Average Family Size
In terms of average family size, the demographic groups most similar to Alaska Natives are Immigrants from Philippines (3.37, a difference of 0.010%), Shoshone (3.37, a difference of 0.030%), Haitian (3.37, a difference of 0.090%), Immigrants from Vietnam (3.38, a difference of 0.11%), and Vietnamese (3.37, a difference of 0.13%).
| Demographics | Rating | Rank | Average Family Size |
| Guyanese | 100.0 /100 | #37 | Exceptional 3.40 |
| Immigrants | Belize | 100.0 /100 | #38 | Exceptional 3.39 |
| Immigrants | Haiti | 100.0 /100 | #39 | Exceptional 3.39 |
| Belizeans | 100.0 /100 | #40 | Exceptional 3.39 |
| Marshallese | 100.0 /100 | #41 | Exceptional 3.38 |
| Immigrants | Vietnam | 100.0 /100 | #42 | Exceptional 3.38 |
| Immigrants | Philippines | 100.0 /100 | #43 | Exceptional 3.37 |
| Alaska Natives | 100.0 /100 | #44 | Exceptional 3.37 |
| Shoshone | 100.0 /100 | #45 | Exceptional 3.37 |
| Haitians | 100.0 /100 | #46 | Exceptional 3.37 |
| Vietnamese | 100.0 /100 | #47 | Exceptional 3.37 |
| Immigrants | Nicaragua | 100.0 /100 | #48 | Exceptional 3.37 |
| Bangladeshis | 100.0 /100 | #49 | Exceptional 3.37 |
| Immigrants | Bangladesh | 100.0 /100 | #50 | Exceptional 3.36 |
| Nicaraguans | 100.0 /100 | #51 | Exceptional 3.36 |
Demographics Similar to Immigrants from Nepal by Average Family Size
In terms of average family size, the demographic groups most similar to Immigrants from Nepal are Immigrants from Morocco (3.21, a difference of 0.010%), Immigrants from India (3.21, a difference of 0.010%), Immigrants from Kenya (3.21, a difference of 0.030%), Immigrants from Poland (3.20, a difference of 0.050%), and Paraguayan (3.20, a difference of 0.060%).
| Demographics | Rating | Rank | Average Family Size |
| Senegalese | 28.2 /100 | #196 | Fair 3.21 |
| Kenyans | 28.0 /100 | #197 | Fair 3.21 |
| Immigrants | Azores | 21.7 /100 | #198 | Fair 3.21 |
| Hmong | 20.7 /100 | #199 | Fair 3.21 |
| Immigrants | Kenya | 19.2 /100 | #200 | Poor 3.21 |
| Immigrants | Morocco | 18.5 /100 | #201 | Poor 3.21 |
| Immigrants | India | 18.5 /100 | #202 | Poor 3.21 |
| Immigrants | Nepal | 18.1 /100 | #203 | Poor 3.21 |
| Immigrants | Poland | 16.6 /100 | #204 | Poor 3.20 |
| Paraguayans | 16.3 /100 | #205 | Poor 3.20 |
| Immigrants | Cabo Verde | 16.0 /100 | #206 | Poor 3.20 |
| Filipinos | 13.6 /100 | #207 | Poor 3.20 |
| Chippewa | 13.3 /100 | #208 | Poor 3.20 |
| Sudanese | 13.3 /100 | #209 | Poor 3.20 |
| Zimbabweans | 12.6 /100 | #210 | Poor 3.20 |