Vietnamese vs Immigrants from Venezuela Average Family Size
COMPARE
Vietnamese
Immigrants from Venezuela
Average Family Size
Average Family Size Comparison
Vietnamese
Immigrants from Venezuela
3.37
AVERAGE FAMILY SIZE
100.0/ 100
METRIC RATING
47th/ 347
METRIC RANK
3.26
AVERAGE FAMILY SIZE
86.3/ 100
METRIC RATING
133rd/ 347
METRIC RANK
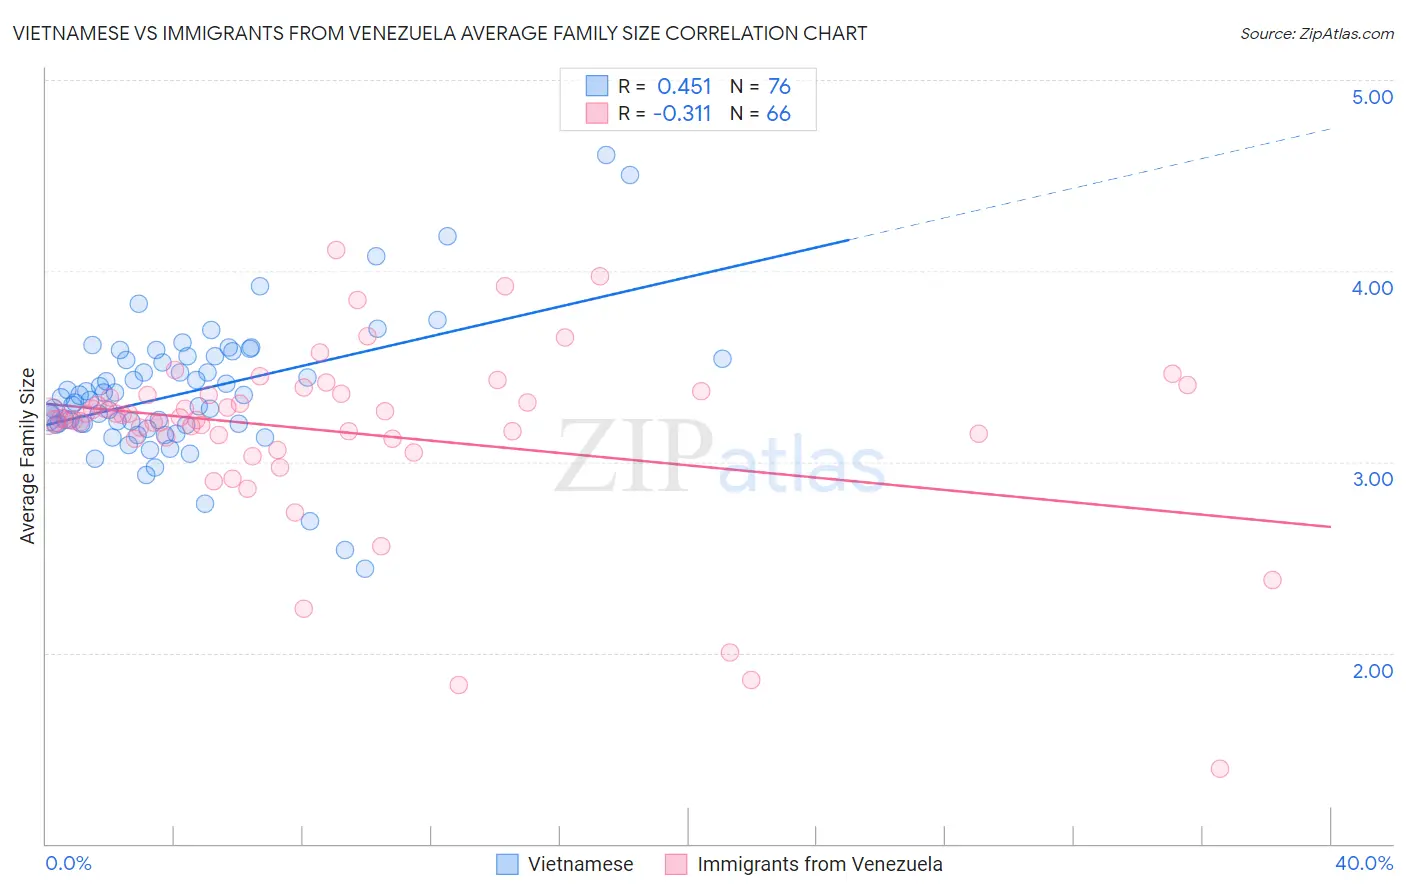
Vietnamese vs Immigrants from Venezuela Average Family Size Correlation Chart
The statistical analysis conducted on geographies consisting of 170,658,830 people shows a moderate positive correlation between the proportion of Vietnamese and average family size in the United States with a correlation coefficient (R) of 0.451 and weighted average of 3.37. Similarly, the statistical analysis conducted on geographies consisting of 287,786,704 people shows a mild negative correlation between the proportion of Immigrants from Venezuela and average family size in the United States with a correlation coefficient (R) of -0.311 and weighted average of 3.26, a difference of 3.5%.
Average Family Size Correlation Summary
| Measurement | Vietnamese | Immigrants from Venezuela |
| Minimum | 2.44 | 1.39 |
| Maximum | 4.61 | 4.11 |
| Range | 2.17 | 2.72 |
| Mean | 3.36 | 3.16 |
| Median | 3.33 | 3.23 |
| Interquartile 25% (IQ1) | 3.20 | 3.12 |
| Interquartile 75% (IQ3) | 3.54 | 3.35 |
| Interquartile Range (IQR) | 0.35 | 0.23 |
| Standard Deviation (Sample) | 0.35 | 0.47 |
| Standard Deviation (Population) | 0.35 | 0.47 |
Similar Demographics by Average Family Size
Demographics Similar to Vietnamese by Average Family Size
In terms of average family size, the demographic groups most similar to Vietnamese are Immigrants from Nicaragua (3.37, a difference of 0.0%), Haitian (3.37, a difference of 0.040%), Bangladeshi (3.37, a difference of 0.070%), Shoshone (3.37, a difference of 0.10%), and Alaska Native (3.37, a difference of 0.13%).
| Demographics | Rating | Rank | Average Family Size |
| Belizeans | 100.0 /100 | #40 | Exceptional 3.39 |
| Marshallese | 100.0 /100 | #41 | Exceptional 3.38 |
| Immigrants | Vietnam | 100.0 /100 | #42 | Exceptional 3.38 |
| Immigrants | Philippines | 100.0 /100 | #43 | Exceptional 3.37 |
| Alaska Natives | 100.0 /100 | #44 | Exceptional 3.37 |
| Shoshone | 100.0 /100 | #45 | Exceptional 3.37 |
| Haitians | 100.0 /100 | #46 | Exceptional 3.37 |
| Vietnamese | 100.0 /100 | #47 | Exceptional 3.37 |
| Immigrants | Nicaragua | 100.0 /100 | #48 | Exceptional 3.37 |
| Bangladeshis | 100.0 /100 | #49 | Exceptional 3.37 |
| Immigrants | Bangladesh | 100.0 /100 | #50 | Exceptional 3.36 |
| Nicaraguans | 100.0 /100 | #51 | Exceptional 3.36 |
| Fijians | 100.0 /100 | #52 | Exceptional 3.36 |
| Koreans | 100.0 /100 | #53 | Exceptional 3.36 |
| Immigrants | South Eastern Asia | 100.0 /100 | #54 | Exceptional 3.36 |
Demographics Similar to Immigrants from Venezuela by Average Family Size
In terms of average family size, the demographic groups most similar to Immigrants from Venezuela are Costa Rican (3.26, a difference of 0.020%), African (3.25, a difference of 0.050%), Immigrants from Western Asia (3.26, a difference of 0.060%), Panamanian (3.25, a difference of 0.070%), and Laotian (3.26, a difference of 0.090%).
| Demographics | Rating | Rank | Average Family Size |
| Immigrants | Costa Rica | 90.7 /100 | #126 | Exceptional 3.26 |
| Immigrants | Syria | 90.6 /100 | #127 | Exceptional 3.26 |
| Colombians | 89.9 /100 | #128 | Excellent 3.26 |
| Immigrants | Hong Kong | 88.6 /100 | #129 | Excellent 3.26 |
| Laotians | 88.5 /100 | #130 | Excellent 3.26 |
| Immigrants | Western Asia | 87.7 /100 | #131 | Excellent 3.26 |
| Costa Ricans | 86.8 /100 | #132 | Excellent 3.26 |
| Immigrants | Venezuela | 86.3 /100 | #133 | Excellent 3.26 |
| Africans | 84.9 /100 | #134 | Excellent 3.25 |
| Panamanians | 84.2 /100 | #135 | Excellent 3.25 |
| Comanche | 82.8 /100 | #136 | Excellent 3.25 |
| Immigrants | Middle Africa | 82.4 /100 | #137 | Excellent 3.25 |
| Cubans | 81.8 /100 | #138 | Excellent 3.25 |
| Immigrants | Ethiopia | 81.6 /100 | #139 | Excellent 3.25 |
| Sub-Saharan Africans | 81.6 /100 | #140 | Excellent 3.25 |