Alsatian vs Immigrants from Venezuela Average Family Size
COMPARE
Alsatian
Immigrants from Venezuela
Average Family Size
Average Family Size Comparison
Alsatians
Immigrants from Venezuela
3.14
AVERAGE FAMILY SIZE
0.2/ 100
METRIC RATING
291st/ 347
METRIC RANK
3.26
AVERAGE FAMILY SIZE
86.3/ 100
METRIC RATING
133rd/ 347
METRIC RANK
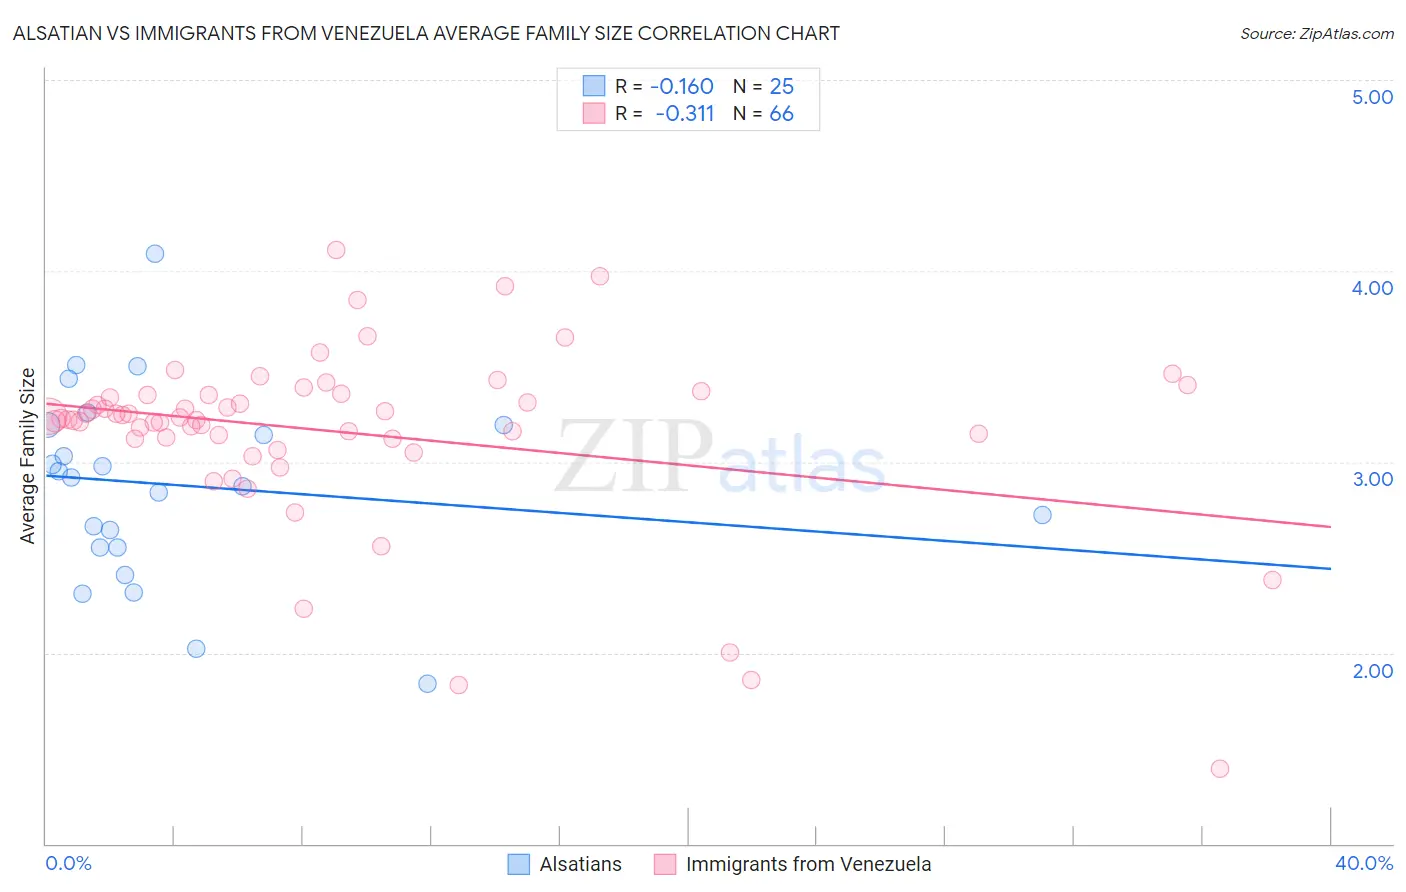
Alsatian vs Immigrants from Venezuela Average Family Size Correlation Chart
The statistical analysis conducted on geographies consisting of 82,680,020 people shows a poor negative correlation between the proportion of Alsatians and average family size in the United States with a correlation coefficient (R) of -0.160 and weighted average of 3.14. Similarly, the statistical analysis conducted on geographies consisting of 287,786,704 people shows a mild negative correlation between the proportion of Immigrants from Venezuela and average family size in the United States with a correlation coefficient (R) of -0.311 and weighted average of 3.26, a difference of 3.7%.
Average Family Size Correlation Summary
| Measurement | Alsatian | Immigrants from Venezuela |
| Minimum | 1.84 | 1.39 |
| Maximum | 4.09 | 4.11 |
| Range | 2.25 | 2.72 |
| Mean | 2.88 | 3.16 |
| Median | 2.92 | 3.23 |
| Interquartile 25% (IQ1) | 2.55 | 3.12 |
| Interquartile 75% (IQ3) | 3.19 | 3.35 |
| Interquartile Range (IQR) | 0.64 | 0.23 |
| Standard Deviation (Sample) | 0.50 | 0.47 |
| Standard Deviation (Population) | 0.49 | 0.47 |
Similar Demographics by Average Family Size
Demographics Similar to Alsatians by Average Family Size
In terms of average family size, the demographic groups most similar to Alsatians are European (3.14, a difference of 0.020%), Scandinavian (3.14, a difference of 0.030%), Cypriot (3.14, a difference of 0.040%), Immigrants from Croatia (3.14, a difference of 0.050%), and Austrian (3.14, a difference of 0.050%).
| Demographics | Rating | Rank | Average Family Size |
| Immigrants | France | 0.4 /100 | #284 | Tragic 3.15 |
| Whites/Caucasians | 0.3 /100 | #285 | Tragic 3.14 |
| Immigrants | Netherlands | 0.3 /100 | #286 | Tragic 3.14 |
| Greeks | 0.3 /100 | #287 | Tragic 3.14 |
| Immigrants | Czechoslovakia | 0.3 /100 | #288 | Tragic 3.14 |
| Immigrants | Norway | 0.3 /100 | #289 | Tragic 3.14 |
| Cypriots | 0.3 /100 | #290 | Tragic 3.14 |
| Alsatians | 0.2 /100 | #291 | Tragic 3.14 |
| Europeans | 0.2 /100 | #292 | Tragic 3.14 |
| Scandinavians | 0.2 /100 | #293 | Tragic 3.14 |
| Immigrants | Croatia | 0.2 /100 | #294 | Tragic 3.14 |
| Austrians | 0.2 /100 | #295 | Tragic 3.14 |
| Ukrainians | 0.2 /100 | #296 | Tragic 3.14 |
| Immigrants | Western Europe | 0.2 /100 | #297 | Tragic 3.14 |
| Colville | 0.2 /100 | #298 | Tragic 3.14 |
Demographics Similar to Immigrants from Venezuela by Average Family Size
In terms of average family size, the demographic groups most similar to Immigrants from Venezuela are Costa Rican (3.26, a difference of 0.020%), African (3.25, a difference of 0.050%), Immigrants from Western Asia (3.26, a difference of 0.060%), Panamanian (3.25, a difference of 0.070%), and Laotian (3.26, a difference of 0.090%).
| Demographics | Rating | Rank | Average Family Size |
| Immigrants | Costa Rica | 90.7 /100 | #126 | Exceptional 3.26 |
| Immigrants | Syria | 90.6 /100 | #127 | Exceptional 3.26 |
| Colombians | 89.9 /100 | #128 | Excellent 3.26 |
| Immigrants | Hong Kong | 88.6 /100 | #129 | Excellent 3.26 |
| Laotians | 88.5 /100 | #130 | Excellent 3.26 |
| Immigrants | Western Asia | 87.7 /100 | #131 | Excellent 3.26 |
| Costa Ricans | 86.8 /100 | #132 | Excellent 3.26 |
| Immigrants | Venezuela | 86.3 /100 | #133 | Excellent 3.26 |
| Africans | 84.9 /100 | #134 | Excellent 3.25 |
| Panamanians | 84.2 /100 | #135 | Excellent 3.25 |
| Comanche | 82.8 /100 | #136 | Excellent 3.25 |
| Immigrants | Middle Africa | 82.4 /100 | #137 | Excellent 3.25 |
| Cubans | 81.8 /100 | #138 | Excellent 3.25 |
| Immigrants | Ethiopia | 81.6 /100 | #139 | Excellent 3.25 |
| Sub-Saharan Africans | 81.6 /100 | #140 | Excellent 3.25 |