Swiss vs Immigrants from Venezuela Average Family Size
COMPARE
Swiss
Immigrants from Venezuela
Average Family Size
Average Family Size Comparison
Swiss
Immigrants from Venezuela
3.15
AVERAGE FAMILY SIZE
0.5/ 100
METRIC RATING
277th/ 347
METRIC RANK
3.26
AVERAGE FAMILY SIZE
86.3/ 100
METRIC RATING
133rd/ 347
METRIC RANK
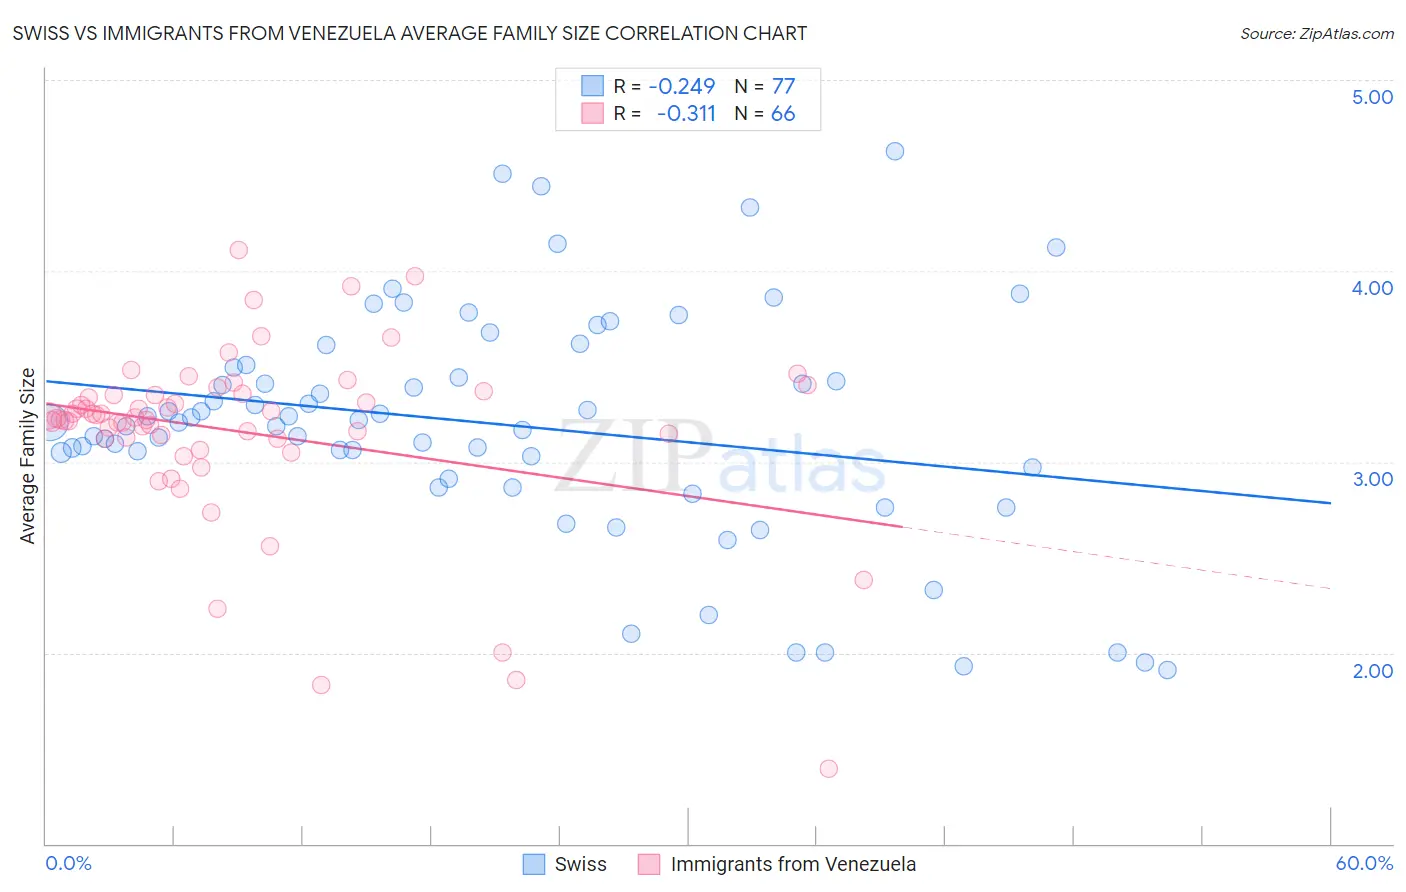
Swiss vs Immigrants from Venezuela Average Family Size Correlation Chart
The statistical analysis conducted on geographies consisting of 464,761,483 people shows a weak negative correlation between the proportion of Swiss and average family size in the United States with a correlation coefficient (R) of -0.249 and weighted average of 3.15. Similarly, the statistical analysis conducted on geographies consisting of 287,786,704 people shows a mild negative correlation between the proportion of Immigrants from Venezuela and average family size in the United States with a correlation coefficient (R) of -0.311 and weighted average of 3.26, a difference of 3.3%.
Average Family Size Correlation Summary
| Measurement | Swiss | Immigrants from Venezuela |
| Minimum | 1.91 | 1.39 |
| Maximum | 4.63 | 4.11 |
| Range | 2.72 | 2.72 |
| Mean | 3.20 | 3.16 |
| Median | 3.21 | 3.23 |
| Interquartile 25% (IQ1) | 2.94 | 3.12 |
| Interquartile 75% (IQ3) | 3.50 | 3.35 |
| Interquartile Range (IQR) | 0.56 | 0.23 |
| Standard Deviation (Sample) | 0.60 | 0.47 |
| Standard Deviation (Population) | 0.60 | 0.47 |
Similar Demographics by Average Family Size
Demographics Similar to Swiss by Average Family Size
In terms of average family size, the demographic groups most similar to Swiss are Immigrants from Bosnia and Herzegovina (3.15, a difference of 0.010%), Okinawan (3.15, a difference of 0.030%), Immigrants from Europe (3.15, a difference of 0.040%), Immigrants from England (3.15, a difference of 0.070%), and New Zealander (3.15, a difference of 0.10%).
| Demographics | Rating | Rank | Average Family Size |
| Tlingit-Haida | 0.7 /100 | #270 | Tragic 3.16 |
| Immigrants | Germany | 0.7 /100 | #271 | Tragic 3.15 |
| Immigrants | Lithuania | 0.6 /100 | #272 | Tragic 3.15 |
| New Zealanders | 0.6 /100 | #273 | Tragic 3.15 |
| Immigrants | Belgium | 0.6 /100 | #274 | Tragic 3.15 |
| Cambodians | 0.6 /100 | #275 | Tragic 3.15 |
| Immigrants | Bosnia and Herzegovina | 0.5 /100 | #276 | Tragic 3.15 |
| Swiss | 0.5 /100 | #277 | Tragic 3.15 |
| Okinawans | 0.5 /100 | #278 | Tragic 3.15 |
| Immigrants | Europe | 0.5 /100 | #279 | Tragic 3.15 |
| Immigrants | England | 0.4 /100 | #280 | Tragic 3.15 |
| Immigrants | Denmark | 0.4 /100 | #281 | Tragic 3.15 |
| Yugoslavians | 0.4 /100 | #282 | Tragic 3.15 |
| German Russians | 0.4 /100 | #283 | Tragic 3.15 |
| Immigrants | France | 0.4 /100 | #284 | Tragic 3.15 |
Demographics Similar to Immigrants from Venezuela by Average Family Size
In terms of average family size, the demographic groups most similar to Immigrants from Venezuela are Costa Rican (3.26, a difference of 0.020%), African (3.25, a difference of 0.050%), Immigrants from Western Asia (3.26, a difference of 0.060%), Panamanian (3.25, a difference of 0.070%), and Laotian (3.26, a difference of 0.090%).
| Demographics | Rating | Rank | Average Family Size |
| Immigrants | Costa Rica | 90.7 /100 | #126 | Exceptional 3.26 |
| Immigrants | Syria | 90.6 /100 | #127 | Exceptional 3.26 |
| Colombians | 89.9 /100 | #128 | Excellent 3.26 |
| Immigrants | Hong Kong | 88.6 /100 | #129 | Excellent 3.26 |
| Laotians | 88.5 /100 | #130 | Excellent 3.26 |
| Immigrants | Western Asia | 87.7 /100 | #131 | Excellent 3.26 |
| Costa Ricans | 86.8 /100 | #132 | Excellent 3.26 |
| Immigrants | Venezuela | 86.3 /100 | #133 | Excellent 3.26 |
| Africans | 84.9 /100 | #134 | Excellent 3.25 |
| Panamanians | 84.2 /100 | #135 | Excellent 3.25 |
| Comanche | 82.8 /100 | #136 | Excellent 3.25 |
| Immigrants | Middle Africa | 82.4 /100 | #137 | Excellent 3.25 |
| Cubans | 81.8 /100 | #138 | Excellent 3.25 |
| Immigrants | Ethiopia | 81.6 /100 | #139 | Excellent 3.25 |
| Sub-Saharan Africans | 81.6 /100 | #140 | Excellent 3.25 |