Czech vs Immigrants from Venezuela Family Households
COMPARE
Czech
Immigrants from Venezuela
Family Households
Family Households Comparison
Czechs
Immigrants from Venezuela
64.5%
FAMILY HOUSEHOLDS
67.0/ 100
METRIC RATING
156th/ 347
METRIC RANK
66.4%
FAMILY HOUSEHOLDS
100.0/ 100
METRIC RATING
48th/ 347
METRIC RANK
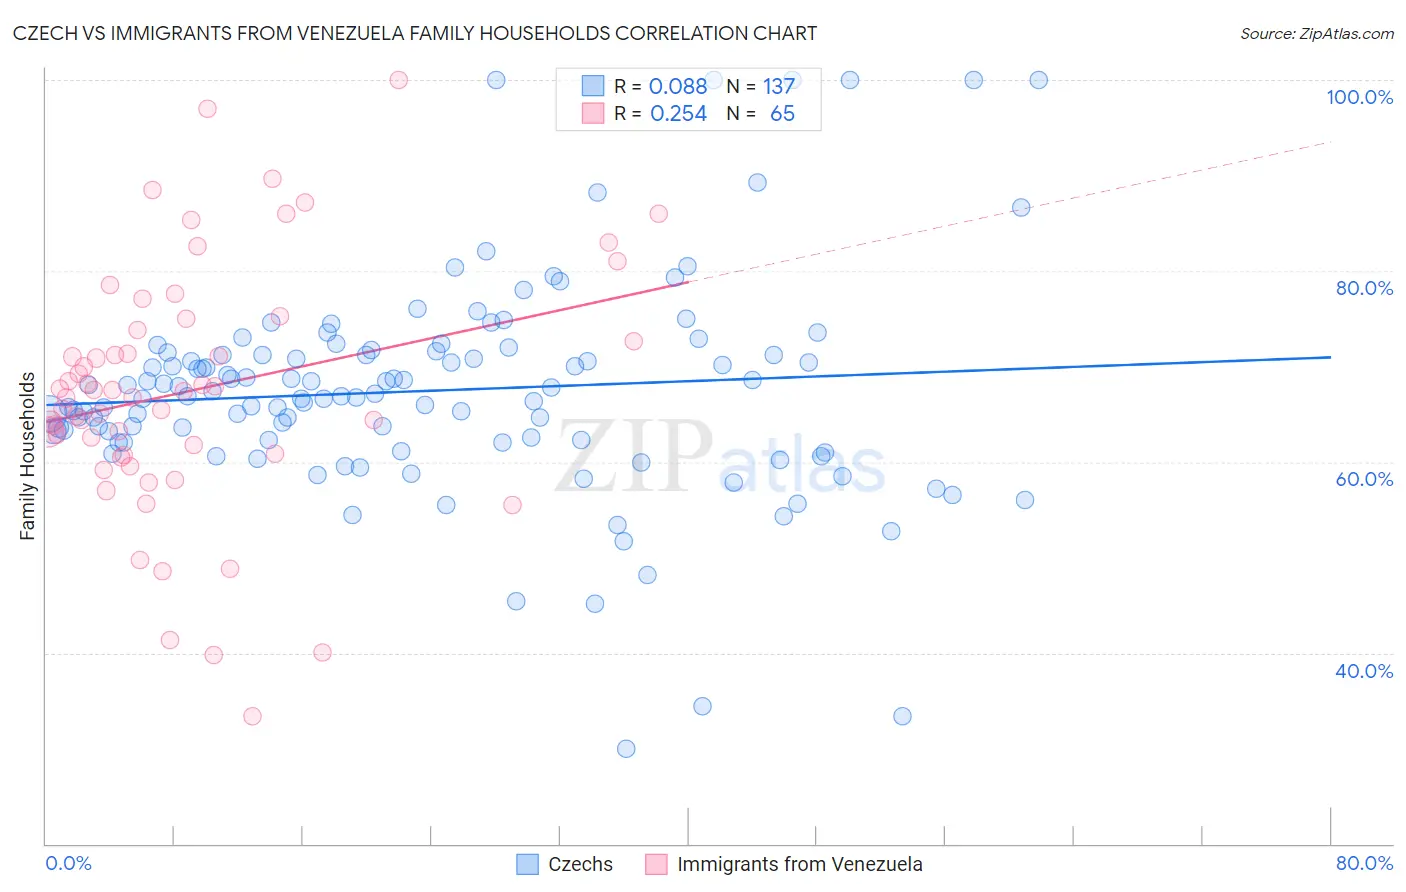
Czech vs Immigrants from Venezuela Family Households Correlation Chart
The statistical analysis conducted on geographies consisting of 484,475,433 people shows a slight positive correlation between the proportion of Czechs and percentage of family households in the United States with a correlation coefficient (R) of 0.088 and weighted average of 64.5%. Similarly, the statistical analysis conducted on geographies consisting of 287,786,549 people shows a weak positive correlation between the proportion of Immigrants from Venezuela and percentage of family households in the United States with a correlation coefficient (R) of 0.254 and weighted average of 66.4%, a difference of 3.1%.
Family Households Correlation Summary
| Measurement | Czech | Immigrants from Venezuela |
| Minimum | 29.9% | 33.3% |
| Maximum | 100.0% | 100.0% |
| Range | 70.1% | 66.7% |
| Mean | 67.4% | 67.5% |
| Median | 66.9% | 67.4% |
| Interquartile 25% (IQ1) | 62.2% | 60.7% |
| Interquartile 75% (IQ3) | 71.4% | 74.4% |
| Interquartile Range (IQR) | 9.2% | 13.6% |
| Standard Deviation (Sample) | 11.4% | 13.1% |
| Standard Deviation (Population) | 11.3% | 13.0% |
Similar Demographics by Family Households
Demographics Similar to Czechs by Family Households
In terms of family households, the demographic groups most similar to Czechs are Uruguayan (64.5%, a difference of 0.010%), Canadian (64.4%, a difference of 0.010%), Lebanese (64.4%, a difference of 0.010%), Austrian (64.5%, a difference of 0.020%), and German (64.4%, a difference of 0.020%).
| Demographics | Rating | Rank | Family Households |
| Sioux | 76.3 /100 | #149 | Good 64.6% |
| Romanians | 75.3 /100 | #150 | Good 64.5% |
| Syrians | 75.2 /100 | #151 | Good 64.5% |
| Scottish | 70.9 /100 | #152 | Good 64.5% |
| Swedes | 69.8 /100 | #153 | Good 64.5% |
| Austrians | 68.5 /100 | #154 | Good 64.5% |
| Uruguayans | 67.7 /100 | #155 | Good 64.5% |
| Czechs | 67.0 /100 | #156 | Good 64.5% |
| Canadians | 66.6 /100 | #157 | Good 64.4% |
| Lebanese | 66.4 /100 | #158 | Good 64.4% |
| Germans | 65.8 /100 | #159 | Good 64.4% |
| Immigrants | Moldova | 65.2 /100 | #160 | Good 64.4% |
| Immigrants | England | 62.6 /100 | #161 | Good 64.4% |
| British | 61.6 /100 | #162 | Good 64.4% |
| Chickasaw | 61.5 /100 | #163 | Good 64.4% |
Demographics Similar to Immigrants from Venezuela by Family Households
In terms of family households, the demographic groups most similar to Immigrants from Venezuela are Bolivian (66.5%, a difference of 0.020%), Arapaho (66.5%, a difference of 0.050%), Immigrants from South Central Asia (66.4%, a difference of 0.050%), Venezuelan (66.5%, a difference of 0.070%), and Asian (66.5%, a difference of 0.090%).
| Demographics | Rating | Rank | Family Households |
| Immigrants | Bolivia | 100.0 /100 | #41 | Exceptional 66.6% |
| Menominee | 100.0 /100 | #42 | Exceptional 66.5% |
| Apache | 100.0 /100 | #43 | Exceptional 66.5% |
| Asians | 100.0 /100 | #44 | Exceptional 66.5% |
| Venezuelans | 100.0 /100 | #45 | Exceptional 66.5% |
| Arapaho | 100.0 /100 | #46 | Exceptional 66.5% |
| Bolivians | 100.0 /100 | #47 | Exceptional 66.5% |
| Immigrants | Venezuela | 100.0 /100 | #48 | Exceptional 66.4% |
| Immigrants | South Central Asia | 100.0 /100 | #49 | Exceptional 66.4% |
| Navajo | 100.0 /100 | #50 | Exceptional 66.4% |
| Natives/Alaskans | 100.0 /100 | #51 | Exceptional 66.4% |
| Colombians | 100.0 /100 | #52 | Exceptional 66.3% |
| Afghans | 100.0 /100 | #53 | Exceptional 66.3% |
| Immigrants | Colombia | 100.0 /100 | #54 | Exceptional 66.3% |
| Immigrants | Immigrants | 100.0 /100 | #55 | Exceptional 66.1% |