Czech vs Immigrants from Lithuania Male Disability
COMPARE
Czech
Immigrants from Lithuania
Male Disability
Male Disability Comparison
Czechs
Immigrants from Lithuania
11.9%
MALE DISABILITY
1.1/ 100
METRIC RATING
240th/ 347
METRIC RANK
10.5%
MALE DISABILITY
98.9/ 100
METRIC RATING
73rd/ 347
METRIC RANK
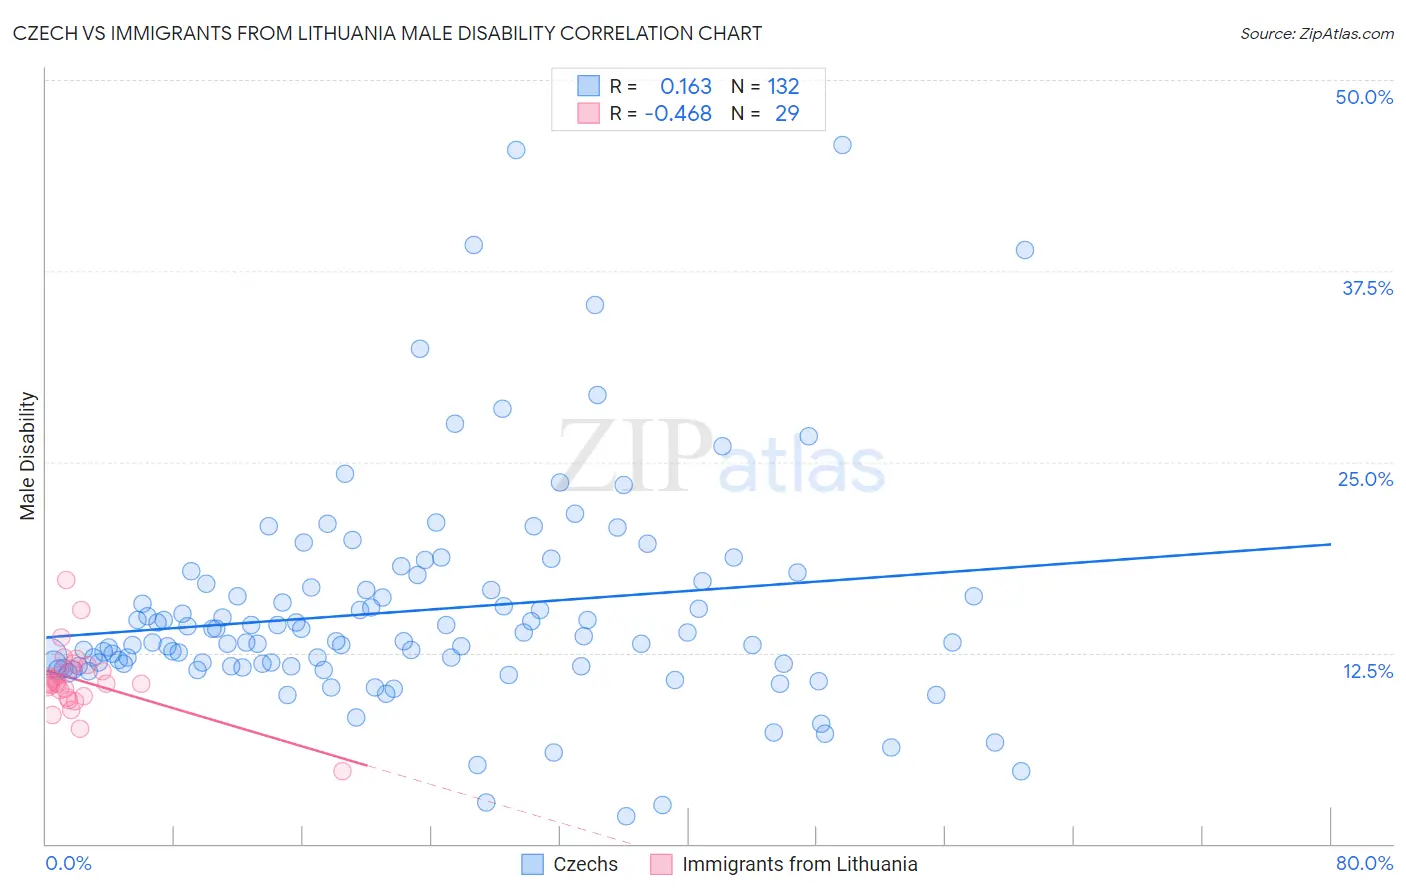
Czech vs Immigrants from Lithuania Male Disability Correlation Chart
The statistical analysis conducted on geographies consisting of 484,720,527 people shows a poor positive correlation between the proportion of Czechs and percentage of males with a disability in the United States with a correlation coefficient (R) of 0.163 and weighted average of 11.9%. Similarly, the statistical analysis conducted on geographies consisting of 117,723,039 people shows a moderate negative correlation between the proportion of Immigrants from Lithuania and percentage of males with a disability in the United States with a correlation coefficient (R) of -0.468 and weighted average of 10.5%, a difference of 13.3%.
Male Disability Correlation Summary
| Measurement | Czech | Immigrants from Lithuania |
| Minimum | 1.8% | 4.7% |
| Maximum | 45.8% | 17.2% |
| Range | 44.0% | 12.5% |
| Mean | 15.3% | 10.7% |
| Median | 13.3% | 10.5% |
| Interquartile 25% (IQ1) | 11.6% | 9.6% |
| Interquartile 75% (IQ3) | 16.9% | 11.6% |
| Interquartile Range (IQR) | 5.3% | 2.0% |
| Standard Deviation (Sample) | 7.2% | 2.2% |
| Standard Deviation (Population) | 7.2% | 2.2% |
Similar Demographics by Male Disability
Demographics Similar to Czechs by Male Disability
In terms of male disability, the demographic groups most similar to Czechs are Bahamian (11.9%, a difference of 0.040%), Italian (11.9%, a difference of 0.050%), Northern European (11.9%, a difference of 0.050%), Samoan (11.9%, a difference of 0.080%), and Yugoslavian (11.9%, a difference of 0.10%).
| Demographics | Rating | Rank | Male Disability |
| Mexicans | 1.7 /100 | #233 | Tragic 11.8% |
| Immigrants | Canada | 1.6 /100 | #234 | Tragic 11.9% |
| Immigrants | North America | 1.5 /100 | #235 | Tragic 11.9% |
| U.S. Virgin Islanders | 1.3 /100 | #236 | Tragic 11.9% |
| Carpatho Rusyns | 1.3 /100 | #237 | Tragic 11.9% |
| Yugoslavians | 1.2 /100 | #238 | Tragic 11.9% |
| Italians | 1.2 /100 | #239 | Tragic 11.9% |
| Czechs | 1.1 /100 | #240 | Tragic 11.9% |
| Bahamians | 1.1 /100 | #241 | Tragic 11.9% |
| Northern Europeans | 1.1 /100 | #242 | Tragic 11.9% |
| Samoans | 1.1 /100 | #243 | Tragic 11.9% |
| Immigrants | Laos | 1.0 /100 | #244 | Tragic 11.9% |
| Immigrants | Liberia | 1.0 /100 | #245 | Tragic 11.9% |
| Danes | 0.9 /100 | #246 | Tragic 11.9% |
| Hungarians | 0.8 /100 | #247 | Tragic 12.0% |
Demographics Similar to Immigrants from Lithuania by Male Disability
In terms of male disability, the demographic groups most similar to Immigrants from Lithuania are Immigrants from Serbia (10.5%, a difference of 0.060%), Immigrants from Cameroon (10.5%, a difference of 0.12%), Immigrants from Lebanon (10.5%, a difference of 0.14%), Sierra Leonean (10.5%, a difference of 0.26%), and Immigrants from Bulgaria (10.5%, a difference of 0.27%).
| Demographics | Rating | Rank | Male Disability |
| Guyanese | 99.2 /100 | #66 | Exceptional 10.5% |
| Immigrants | Afghanistan | 99.2 /100 | #67 | Exceptional 10.5% |
| Colombians | 99.2 /100 | #68 | Exceptional 10.5% |
| Ecuadorians | 99.2 /100 | #69 | Exceptional 10.5% |
| Immigrants | Bulgaria | 99.1 /100 | #70 | Exceptional 10.5% |
| Immigrants | Cameroon | 99.0 /100 | #71 | Exceptional 10.5% |
| Immigrants | Serbia | 99.0 /100 | #72 | Exceptional 10.5% |
| Immigrants | Lithuania | 98.9 /100 | #73 | Exceptional 10.5% |
| Immigrants | Lebanon | 98.8 /100 | #74 | Exceptional 10.5% |
| Sierra Leoneans | 98.7 /100 | #75 | Exceptional 10.5% |
| Immigrants | Sierra Leone | 98.7 /100 | #76 | Exceptional 10.5% |
| Laotians | 98.6 /100 | #77 | Exceptional 10.6% |
| Immigrants | Russia | 98.6 /100 | #78 | Exceptional 10.6% |
| Zimbabweans | 98.4 /100 | #79 | Exceptional 10.6% |
| Immigrants | Jordan | 98.4 /100 | #80 | Exceptional 10.6% |