Czechoslovakian vs English Currently Married
COMPARE
Czechoslovakian
English
Currently Married
Currently Married Comparison
Czechoslovakians
English
48.8%
CURRENTLY MARRIED
99.4/ 100
METRIC RATING
38th/ 347
METRIC RANK
49.7%
CURRENTLY MARRIED
99.9/ 100
METRIC RATING
11th/ 347
METRIC RANK
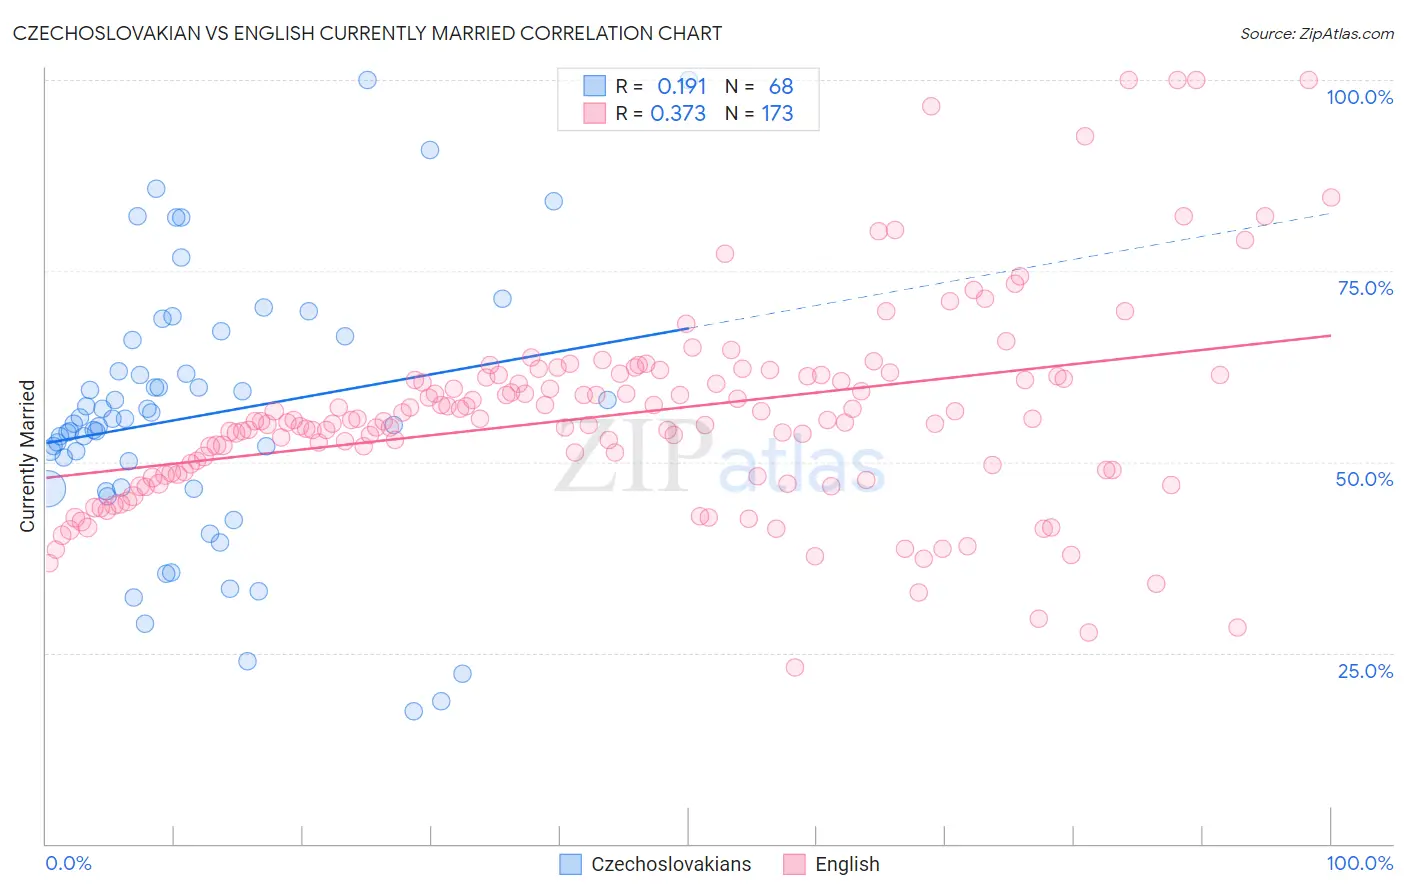
Czechoslovakian vs English Currently Married Correlation Chart
The statistical analysis conducted on geographies consisting of 368,635,685 people shows a poor positive correlation between the proportion of Czechoslovakians and percentage of population currently married in the United States with a correlation coefficient (R) of 0.191 and weighted average of 48.8%. Similarly, the statistical analysis conducted on geographies consisting of 579,833,471 people shows a mild positive correlation between the proportion of English and percentage of population currently married in the United States with a correlation coefficient (R) of 0.373 and weighted average of 49.7%, a difference of 1.9%.
Currently Married Correlation Summary
| Measurement | Czechoslovakian | English |
| Minimum | 17.3% | 23.0% |
| Maximum | 100.0% | 100.0% |
| Range | 82.7% | 77.0% |
| Mean | 56.0% | 56.1% |
| Median | 55.3% | 55.3% |
| Interquartile 25% (IQ1) | 46.6% | 48.4% |
| Interquartile 75% (IQ3) | 63.9% | 61.2% |
| Interquartile Range (IQR) | 17.3% | 12.7% |
| Standard Deviation (Sample) | 17.4% | 13.2% |
| Standard Deviation (Population) | 17.3% | 13.1% |
Similar Demographics by Currently Married
Demographics Similar to Czechoslovakians by Currently Married
In terms of currently married, the demographic groups most similar to Czechoslovakians are British (48.8%, a difference of 0.030%), Italian (48.8%, a difference of 0.040%), Hungarian (48.8%, a difference of 0.040%), Immigrants from Northern Europe (48.8%, a difference of 0.050%), and Immigrants from Canada (48.8%, a difference of 0.050%).
| Demographics | Rating | Rank | Currently Married |
| Poles | 99.5 /100 | #31 | Exceptional 48.9% |
| Immigrants | Hong Kong | 99.5 /100 | #32 | Exceptional 48.9% |
| Irish | 99.5 /100 | #33 | Exceptional 48.9% |
| Immigrants | Lithuania | 99.4 /100 | #34 | Exceptional 48.8% |
| Immigrants | Northern Europe | 99.4 /100 | #35 | Exceptional 48.8% |
| Italians | 99.4 /100 | #36 | Exceptional 48.8% |
| Hungarians | 99.4 /100 | #37 | Exceptional 48.8% |
| Czechoslovakians | 99.4 /100 | #38 | Exceptional 48.8% |
| British | 99.4 /100 | #39 | Exceptional 48.8% |
| Immigrants | Canada | 99.4 /100 | #40 | Exceptional 48.8% |
| Greeks | 99.3 /100 | #41 | Exceptional 48.8% |
| Finns | 99.3 /100 | #42 | Exceptional 48.8% |
| Scotch-Irish | 99.3 /100 | #43 | Exceptional 48.7% |
| Immigrants | North America | 99.3 /100 | #44 | Exceptional 48.7% |
| Belgians | 99.3 /100 | #45 | Exceptional 48.7% |
Demographics Similar to English by Currently Married
In terms of currently married, the demographic groups most similar to English are Swiss (49.7%, a difference of 0.0%), Filipino (49.7%, a difference of 0.010%), Dutch (49.6%, a difference of 0.26%), Czech (49.9%, a difference of 0.27%), and German (49.6%, a difference of 0.28%).
| Demographics | Rating | Rank | Currently Married |
| Immigrants | Taiwan | 100.0 /100 | #4 | Exceptional 50.7% |
| Danes | 100.0 /100 | #5 | Exceptional 50.5% |
| Norwegians | 100.0 /100 | #6 | Exceptional 50.2% |
| Immigrants | South Central Asia | 100.0 /100 | #7 | Exceptional 50.0% |
| Swedes | 100.0 /100 | #8 | Exceptional 50.0% |
| Czechs | 99.9 /100 | #9 | Exceptional 49.9% |
| Filipinos | 99.9 /100 | #10 | Exceptional 49.7% |
| English | 99.9 /100 | #11 | Exceptional 49.7% |
| Swiss | 99.9 /100 | #12 | Exceptional 49.7% |
| Dutch | 99.9 /100 | #13 | Exceptional 49.6% |
| Germans | 99.9 /100 | #14 | Exceptional 49.6% |
| Pennsylvania Germans | 99.9 /100 | #15 | Exceptional 49.6% |
| Chinese | 99.9 /100 | #16 | Exceptional 49.5% |
| Scandinavians | 99.9 /100 | #17 | Exceptional 49.5% |
| Immigrants | Scotland | 99.8 /100 | #18 | Exceptional 49.3% |