Czechoslovakian vs Immigrants from Middle Africa Currently Married
COMPARE
Czechoslovakian
Immigrants from Middle Africa
Currently Married
Currently Married Comparison
Czechoslovakians
Immigrants from Middle Africa
48.8%
CURRENTLY MARRIED
99.4/ 100
METRIC RATING
38th/ 347
METRIC RANK
43.0%
CURRENTLY MARRIED
0.0/ 100
METRIC RATING
285th/ 347
METRIC RANK
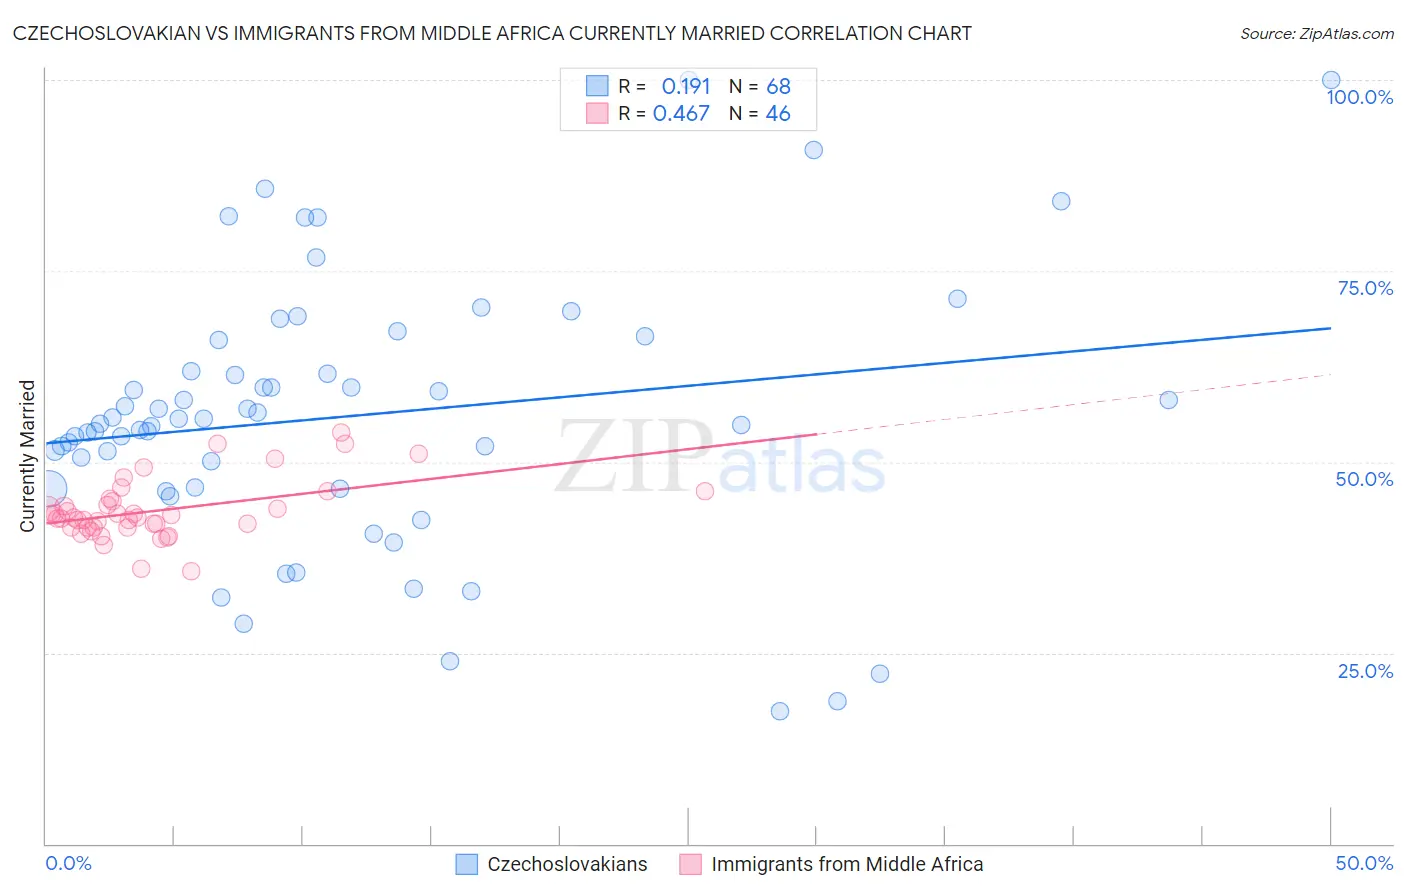
Czechoslovakian vs Immigrants from Middle Africa Currently Married Correlation Chart
The statistical analysis conducted on geographies consisting of 368,635,685 people shows a poor positive correlation between the proportion of Czechoslovakians and percentage of population currently married in the United States with a correlation coefficient (R) of 0.191 and weighted average of 48.8%. Similarly, the statistical analysis conducted on geographies consisting of 202,724,037 people shows a moderate positive correlation between the proportion of Immigrants from Middle Africa and percentage of population currently married in the United States with a correlation coefficient (R) of 0.467 and weighted average of 43.0%, a difference of 13.6%.
Currently Married Correlation Summary
| Measurement | Czechoslovakian | Immigrants from Middle Africa |
| Minimum | 17.3% | 35.6% |
| Maximum | 100.0% | 53.8% |
| Range | 82.7% | 18.2% |
| Mean | 56.0% | 43.6% |
| Median | 55.3% | 42.8% |
| Interquartile 25% (IQ1) | 46.6% | 41.4% |
| Interquartile 75% (IQ3) | 63.9% | 44.8% |
| Interquartile Range (IQR) | 17.3% | 3.4% |
| Standard Deviation (Sample) | 17.4% | 3.9% |
| Standard Deviation (Population) | 17.3% | 3.8% |
Similar Demographics by Currently Married
Demographics Similar to Czechoslovakians by Currently Married
In terms of currently married, the demographic groups most similar to Czechoslovakians are British (48.8%, a difference of 0.030%), Italian (48.8%, a difference of 0.040%), Hungarian (48.8%, a difference of 0.040%), Immigrants from Northern Europe (48.8%, a difference of 0.050%), and Immigrants from Canada (48.8%, a difference of 0.050%).
| Demographics | Rating | Rank | Currently Married |
| Poles | 99.5 /100 | #31 | Exceptional 48.9% |
| Immigrants | Hong Kong | 99.5 /100 | #32 | Exceptional 48.9% |
| Irish | 99.5 /100 | #33 | Exceptional 48.9% |
| Immigrants | Lithuania | 99.4 /100 | #34 | Exceptional 48.8% |
| Immigrants | Northern Europe | 99.4 /100 | #35 | Exceptional 48.8% |
| Italians | 99.4 /100 | #36 | Exceptional 48.8% |
| Hungarians | 99.4 /100 | #37 | Exceptional 48.8% |
| Czechoslovakians | 99.4 /100 | #38 | Exceptional 48.8% |
| British | 99.4 /100 | #39 | Exceptional 48.8% |
| Immigrants | Canada | 99.4 /100 | #40 | Exceptional 48.8% |
| Greeks | 99.3 /100 | #41 | Exceptional 48.8% |
| Finns | 99.3 /100 | #42 | Exceptional 48.8% |
| Scotch-Irish | 99.3 /100 | #43 | Exceptional 48.7% |
| Immigrants | North America | 99.3 /100 | #44 | Exceptional 48.7% |
| Belgians | 99.3 /100 | #45 | Exceptional 48.7% |
Demographics Similar to Immigrants from Middle Africa by Currently Married
In terms of currently married, the demographic groups most similar to Immigrants from Middle Africa are Ghanaian (42.9%, a difference of 0.13%), Guatemalan (42.9%, a difference of 0.15%), Kiowa (43.2%, a difference of 0.40%), Immigrants from El Salvador (43.1%, a difference of 0.40%), and Native/Alaskan (42.8%, a difference of 0.42%).
| Demographics | Rating | Rank | Currently Married |
| Central Americans | 0.0 /100 | #278 | Tragic 43.3% |
| Central American Indians | 0.0 /100 | #279 | Tragic 43.3% |
| Apache | 0.0 /100 | #280 | Tragic 43.2% |
| Chippewa | 0.0 /100 | #281 | Tragic 43.2% |
| Immigrants | Ecuador | 0.0 /100 | #282 | Tragic 43.2% |
| Kiowa | 0.0 /100 | #283 | Tragic 43.2% |
| Immigrants | El Salvador | 0.0 /100 | #284 | Tragic 43.1% |
| Immigrants | Middle Africa | 0.0 /100 | #285 | Tragic 43.0% |
| Ghanaians | 0.0 /100 | #286 | Tragic 42.9% |
| Guatemalans | 0.0 /100 | #287 | Tragic 42.9% |
| Natives/Alaskans | 0.0 /100 | #288 | Tragic 42.8% |
| Paiute | 0.0 /100 | #289 | Tragic 42.7% |
| Immigrants | Ghana | 0.0 /100 | #290 | Tragic 42.7% |
| Immigrants | Guatemala | 0.0 /100 | #291 | Tragic 42.6% |
| Sub-Saharan Africans | 0.0 /100 | #292 | Tragic 42.6% |