Immigrants from Pakistan vs Immigrants from Kuwait Currently Married
COMPARE
Immigrants from Pakistan
Immigrants from Kuwait
Currently Married
Currently Married Comparison
Immigrants from Pakistan
Immigrants from Kuwait
49.1%
CURRENTLY MARRIED
99.7/ 100
METRIC RATING
23rd/ 347
METRIC RANK
46.1%
CURRENTLY MARRIED
21.7/ 100
METRIC RATING
197th/ 347
METRIC RANK
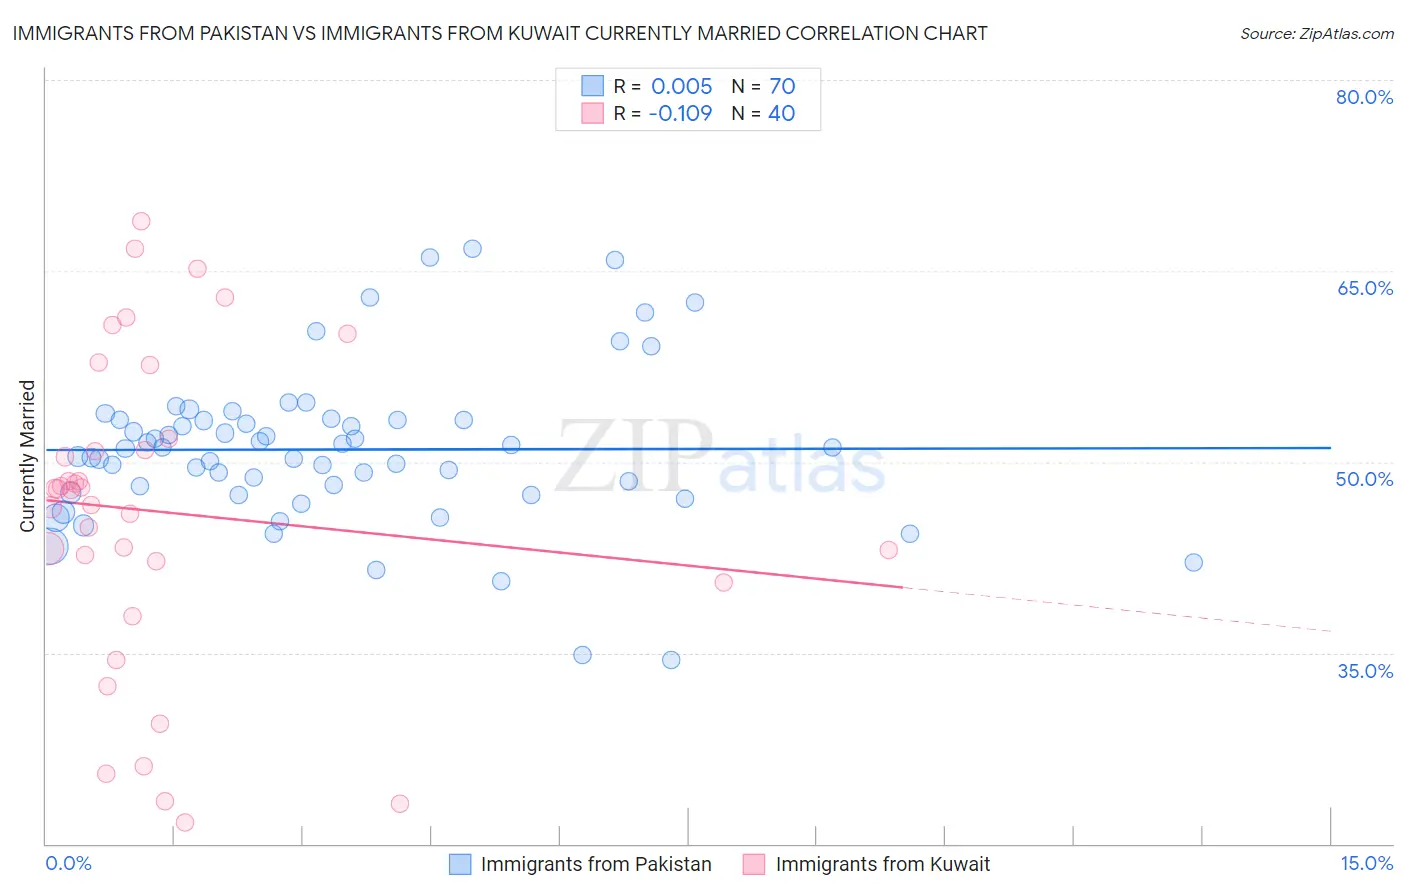
Immigrants from Pakistan vs Immigrants from Kuwait Currently Married Correlation Chart
The statistical analysis conducted on geographies consisting of 283,886,869 people shows no correlation between the proportion of Immigrants from Pakistan and percentage of population currently married in the United States with a correlation coefficient (R) of 0.005 and weighted average of 49.1%. Similarly, the statistical analysis conducted on geographies consisting of 136,899,142 people shows a poor negative correlation between the proportion of Immigrants from Kuwait and percentage of population currently married in the United States with a correlation coefficient (R) of -0.109 and weighted average of 46.1%, a difference of 6.5%.
Currently Married Correlation Summary
| Measurement | Immigrants from Pakistan | Immigrants from Kuwait |
| Minimum | 34.4% | 21.7% |
| Maximum | 66.7% | 68.9% |
| Range | 32.3% | 47.2% |
| Mean | 51.0% | 46.1% |
| Median | 51.1% | 47.8% |
| Interquartile 25% (IQ1) | 47.6% | 41.4% |
| Interquartile 75% (IQ3) | 53.3% | 51.4% |
| Interquartile Range (IQR) | 5.7% | 10.0% |
| Standard Deviation (Sample) | 6.2% | 12.3% |
| Standard Deviation (Population) | 6.1% | 12.1% |
Similar Demographics by Currently Married
Demographics Similar to Immigrants from Pakistan by Currently Married
In terms of currently married, the demographic groups most similar to Immigrants from Pakistan are Bulgarian (49.1%, a difference of 0.11%), Lithuanian (49.0%, a difference of 0.11%), Maltese (49.0%, a difference of 0.12%), Immigrants from Korea (49.0%, a difference of 0.17%), and Burmese (48.9%, a difference of 0.24%).
| Demographics | Rating | Rank | Currently Married |
| Chinese | 99.9 /100 | #16 | Exceptional 49.5% |
| Scandinavians | 99.9 /100 | #17 | Exceptional 49.5% |
| Immigrants | Scotland | 99.8 /100 | #18 | Exceptional 49.3% |
| Europeans | 99.8 /100 | #19 | Exceptional 49.3% |
| Luxembourgers | 99.8 /100 | #20 | Exceptional 49.3% |
| Scottish | 99.8 /100 | #21 | Exceptional 49.2% |
| Bulgarians | 99.7 /100 | #22 | Exceptional 49.1% |
| Immigrants | Pakistan | 99.7 /100 | #23 | Exceptional 49.1% |
| Lithuanians | 99.6 /100 | #24 | Exceptional 49.0% |
| Maltese | 99.6 /100 | #25 | Exceptional 49.0% |
| Immigrants | Korea | 99.6 /100 | #26 | Exceptional 49.0% |
| Burmese | 99.6 /100 | #27 | Exceptional 48.9% |
| Welsh | 99.5 /100 | #28 | Exceptional 48.9% |
| Croatians | 99.5 /100 | #29 | Exceptional 48.9% |
| Eastern Europeans | 99.5 /100 | #30 | Exceptional 48.9% |
Demographics Similar to Immigrants from Kuwait by Currently Married
In terms of currently married, the demographic groups most similar to Immigrants from Kuwait are Immigrants from Bosnia and Herzegovina (46.1%, a difference of 0.030%), Immigrants from Colombia (46.1%, a difference of 0.040%), Immigrants from Nepal (46.1%, a difference of 0.10%), South American (46.1%, a difference of 0.11%), and Immigrants from Costa Rica (46.0%, a difference of 0.12%).
| Demographics | Rating | Rank | Currently Married |
| Choctaw | 29.1 /100 | #190 | Fair 46.3% |
| Immigrants | France | 27.7 /100 | #191 | Fair 46.2% |
| Soviet Union | 25.7 /100 | #192 | Fair 46.2% |
| Immigrants | Fiji | 25.0 /100 | #193 | Fair 46.2% |
| South Americans | 23.8 /100 | #194 | Fair 46.1% |
| Immigrants | Nepal | 23.7 /100 | #195 | Fair 46.1% |
| Immigrants | Bosnia and Herzegovina | 22.2 /100 | #196 | Fair 46.1% |
| Immigrants | Kuwait | 21.7 /100 | #197 | Fair 46.1% |
| Immigrants | Colombia | 21.0 /100 | #198 | Fair 46.1% |
| Immigrants | Costa Rica | 19.6 /100 | #199 | Poor 46.0% |
| Creek | 17.2 /100 | #200 | Poor 46.0% |
| Malaysians | 15.3 /100 | #201 | Poor 45.9% |
| Immigrants | Albania | 14.5 /100 | #202 | Poor 45.9% |
| Taiwanese | 11.7 /100 | #203 | Poor 45.8% |
| Immigrants | Spain | 11.6 /100 | #204 | Poor 45.8% |