Russian vs Immigrants from Kuwait Currently Married
COMPARE
Russian
Immigrants from Kuwait
Currently Married
Currently Married Comparison
Russians
Immigrants from Kuwait
48.6%
CURRENTLY MARRIED
98.9/ 100
METRIC RATING
52nd/ 347
METRIC RANK
46.1%
CURRENTLY MARRIED
21.7/ 100
METRIC RATING
197th/ 347
METRIC RANK
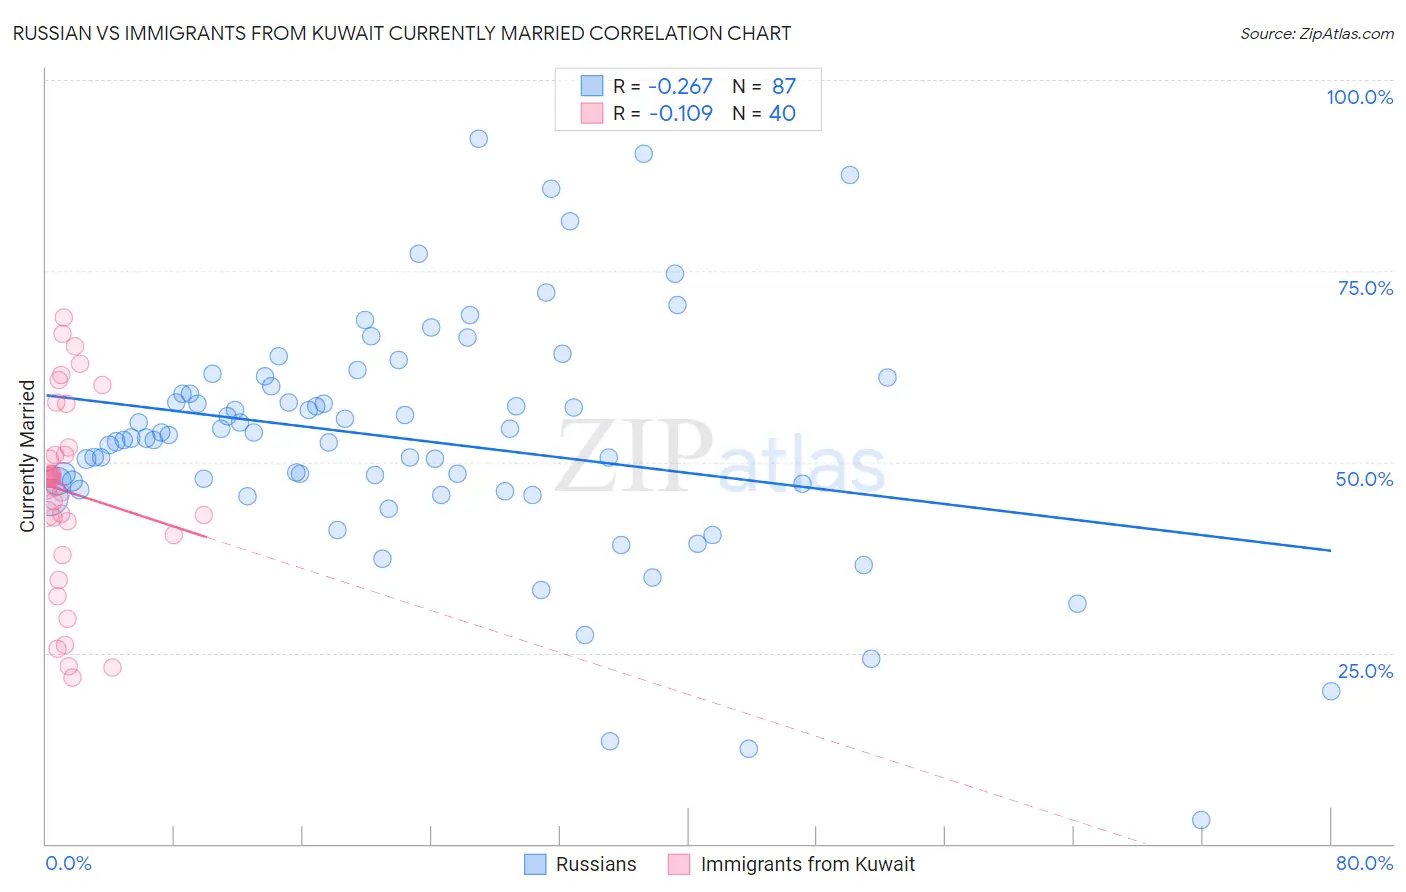
Russian vs Immigrants from Kuwait Currently Married Correlation Chart
The statistical analysis conducted on geographies consisting of 512,168,988 people shows a weak negative correlation between the proportion of Russians and percentage of population currently married in the United States with a correlation coefficient (R) of -0.267 and weighted average of 48.6%. Similarly, the statistical analysis conducted on geographies consisting of 136,899,142 people shows a poor negative correlation between the proportion of Immigrants from Kuwait and percentage of population currently married in the United States with a correlation coefficient (R) of -0.109 and weighted average of 46.1%, a difference of 5.4%.
Currently Married Correlation Summary
| Measurement | Russian | Immigrants from Kuwait |
| Minimum | 3.1% | 21.7% |
| Maximum | 92.3% | 68.9% |
| Range | 89.2% | 47.2% |
| Mean | 52.9% | 46.1% |
| Median | 53.1% | 47.8% |
| Interquartile 25% (IQ1) | 46.3% | 41.4% |
| Interquartile 75% (IQ3) | 59.8% | 51.4% |
| Interquartile Range (IQR) | 13.5% | 10.0% |
| Standard Deviation (Sample) | 15.7% | 12.3% |
| Standard Deviation (Population) | 15.6% | 12.1% |
Similar Demographics by Currently Married
Demographics Similar to Russians by Currently Married
In terms of currently married, the demographic groups most similar to Russians are Iranian (48.6%, a difference of 0.090%), White/Caucasian (48.6%, a difference of 0.090%), Immigrants from Austria (48.5%, a difference of 0.12%), Bhutanese (48.6%, a difference of 0.16%), and Immigrants from Moldova (48.5%, a difference of 0.18%).
| Demographics | Rating | Rank | Currently Married |
| Belgians | 99.3 /100 | #45 | Exceptional 48.7% |
| Immigrants | Iran | 99.2 /100 | #46 | Exceptional 48.7% |
| Northern Europeans | 99.2 /100 | #47 | Exceptional 48.7% |
| Austrians | 99.2 /100 | #48 | Exceptional 48.7% |
| Bhutanese | 99.1 /100 | #49 | Exceptional 48.6% |
| Iranians | 99.0 /100 | #50 | Exceptional 48.6% |
| Whites/Caucasians | 99.0 /100 | #51 | Exceptional 48.6% |
| Russians | 98.9 /100 | #52 | Exceptional 48.6% |
| Immigrants | Austria | 98.8 /100 | #53 | Exceptional 48.5% |
| Immigrants | Moldova | 98.7 /100 | #54 | Exceptional 48.5% |
| Immigrants | North Macedonia | 98.7 /100 | #55 | Exceptional 48.5% |
| Latvians | 98.7 /100 | #56 | Exceptional 48.5% |
| Immigrants | Netherlands | 98.6 /100 | #57 | Exceptional 48.5% |
| French | 98.6 /100 | #58 | Exceptional 48.4% |
| Immigrants | Ireland | 98.5 /100 | #59 | Exceptional 48.4% |
Demographics Similar to Immigrants from Kuwait by Currently Married
In terms of currently married, the demographic groups most similar to Immigrants from Kuwait are Immigrants from Bosnia and Herzegovina (46.1%, a difference of 0.030%), Immigrants from Colombia (46.1%, a difference of 0.040%), Immigrants from Nepal (46.1%, a difference of 0.10%), South American (46.1%, a difference of 0.11%), and Immigrants from Costa Rica (46.0%, a difference of 0.12%).
| Demographics | Rating | Rank | Currently Married |
| Choctaw | 29.1 /100 | #190 | Fair 46.3% |
| Immigrants | France | 27.7 /100 | #191 | Fair 46.2% |
| Soviet Union | 25.7 /100 | #192 | Fair 46.2% |
| Immigrants | Fiji | 25.0 /100 | #193 | Fair 46.2% |
| South Americans | 23.8 /100 | #194 | Fair 46.1% |
| Immigrants | Nepal | 23.7 /100 | #195 | Fair 46.1% |
| Immigrants | Bosnia and Herzegovina | 22.2 /100 | #196 | Fair 46.1% |
| Immigrants | Kuwait | 21.7 /100 | #197 | Fair 46.1% |
| Immigrants | Colombia | 21.0 /100 | #198 | Fair 46.1% |
| Immigrants | Costa Rica | 19.6 /100 | #199 | Poor 46.0% |
| Creek | 17.2 /100 | #200 | Poor 46.0% |
| Malaysians | 15.3 /100 | #201 | Poor 45.9% |
| Immigrants | Albania | 14.5 /100 | #202 | Poor 45.9% |
| Taiwanese | 11.7 /100 | #203 | Poor 45.8% |
| Immigrants | Spain | 11.6 /100 | #204 | Poor 45.8% |