Czechoslovakian vs Immigrants from Bolivia Currently Married

COMPARE

Czechoslovakian
Race
Ancestry
AfghanAfricanAlaska NativeAlaskan AthabascanAlbanianAleutAlsatianAmericanApacheArabArapahoArgentineanArmenianAssyrian/Chaldean/SyriacAustralianAustrianBahamianBangladeshiBarbadianBasqueBelgianBelizeanBermudanBhutaneseBlackfeetBolivianBrazilianBritishBritish West IndianBulgarianBurmeseCajunCambodianCanadianCape VerdeanCarpatho RusynCelticCentral AmericanCentral American IndianCherokeeCheyenneChickasawChileanChineseChippewaChoctawColombianColvilleComancheCosta RicanCreeCreekCroatianCrowCubanCypriotCzechCzechoslovakianDanishDelawareDominicanDutchDutch West IndianEastern EuropeanEcuadorianEgyptianEnglishEstonianEthiopianEuropeanFijianFilipinoFinnishFrenchFrench American IndianFrench CanadianGermanGerman RussianGhanaianGreekGuamanian/ChamorroGuatemalanGuyaneseHaitianHmongHonduranHopiHoumaHungarianIcelanderIndian (Asian)IndonesianInupiatIranianIraqiIrishIroquoisIsraeliItalianJamaicanJapaneseJordanianKenyanKiowaKoreanLaotianLatvianLebaneseLiberianLithuanianLumbeeLuxembourgerMacedonianMalaysianMalteseMarshalleseMenomineeMexicanMexican American IndianMongolianMoroccanNative HawaiianNavajoNepaleseNew ZealanderNicaraguanNigerianNorthern EuropeanNorwegianOkinawanOsageOttawaPaiutePakistaniPalestinianPanamanianParaguayanPennsylvania GermanPeruvianPimaPolishPortuguesePotawatomiPuebloPuerto RicanPuget Sound SalishRomanianRussianSalvadoranSamoanScandinavianScotch-IrishScottishSeminoleSenegaleseSerbianShoshoneSierra LeoneanSiouxSlavicSlovakSloveneSomaliSouth AfricanSouth AmericanSouth American IndianSoviet UnionSpaniardSpanishSpanish AmericanSpanish American IndianSri LankanSubsaharan AfricanSudaneseSwedishSwissSyrianTaiwaneseThaiTlingit-HaidaTohono O'OdhamTonganTrinidadian and TobagonianTsimshianTurkishU.S. Virgin IslanderUgandanUkrainianUruguayanUteVenezuelanVietnameseWelshWest IndianYakamaYaquiYugoslavianYumanYup'ikZimbabwean
Immigration
NonimmigrantsImmigrantsAfghanistanAfricaAlbaniaArgentinaArmeniaAsiaAustraliaAustriaBahamasBangladeshBarbadosBelarusBelgiumBelizeBosnia and HerzegovinaBrazilBulgariaBurma/MyanmarCabo VerdeCambodiaCameroonCanadaCaribbeanCentral AmericaChileChinaColombiaCongoCosta RicaCroatiaCubaCzechoslovakiaDenmarkDominicaDominican RepublicEastern AfricaEastern AsiaEastern EuropeEcuadorEgyptEl SalvadorEnglandEritreaEthiopiaEuropeFijiFranceGermanyGhanaGreeceGrenadaGuatemalaGuyanaHaitiHondurasHong KongHungaryIndiaIndonesiaIranIraqIrelandIsraelItalyJamaicaJapanJordanKazakhstanKenyaKoreaKuwaitLaosLatin AmericaLatviaLebanonLiberiaLithuaniaMalaysiaMexicoMicronesiaMiddle AfricaMoldovaMoroccoNepalNetherlandsNicaraguaNigeriaNorth AmericaNorth MacedoniaNorthern AfricaNorthern EuropeNorwayOceaniaPakistanPanamaPeruPhilippinesPolandPortugalRomaniaRussiaSaudi ArabiaScotlandSenegalSerbiaSierra LeoneSingaporeSomaliaSouth AfricaSouth AmericaSouth Central AsiaSouth Eastern AsiaSouthern EuropeSpainSri LankaSt. Vincent and the GrenadinesSudanSwedenSwitzerlandSyriaTaiwanThailandTrinidad and TobagoTurkeyUgandaUkraineUruguayUzbekistanVenezuelaVietnamWest IndiesWestern AfricaWestern AsiaWestern EuropeYemenZaireZimbabweAzores
Immigrants from Bolivia
Race
Ancestry
AfghanAfricanAlaska NativeAlaskan AthabascanAlbanianAleutAlsatianAmericanApacheArabArapahoArgentineanArmenianAssyrian/Chaldean/SyriacAustralianAustrianBahamianBangladeshiBarbadianBasqueBelgianBelizeanBermudanBhutaneseBlackfeetBolivianBrazilianBritishBritish West IndianBulgarianBurmeseCajunCambodianCanadianCape VerdeanCarpatho RusynCelticCentral AmericanCentral American IndianCherokeeCheyenneChickasawChileanChineseChippewaChoctawColombianColvilleComancheCosta RicanCreeCreekCroatianCrowCubanCypriotCzechDanishDelawareDominicanDutchDutch West IndianEastern EuropeanEcuadorianEgyptianEnglishEstonianEthiopianEuropeanFijianFilipinoFinnishFrenchFrench American IndianFrench CanadianGermanGerman RussianGhanaianGreekGuamanian/ChamorroGuatemalanGuyaneseHaitianHmongHonduranHopiHoumaHungarianIcelanderIndian (Asian)IndonesianInupiatIranianIraqiIrishIroquoisIsraeliItalianJamaicanJapaneseJordanianKenyanKiowaKoreanLaotianLatvianLebaneseLiberianLithuanianLumbeeLuxembourgerMacedonianMalaysianMalteseMarshalleseMenomineeMexicanMexican American IndianMongolianMoroccanNative HawaiianNavajoNepaleseNew ZealanderNicaraguanNigerianNorthern EuropeanNorwegianOkinawanOsageOttawaPaiutePakistaniPalestinianPanamanianParaguayanPennsylvania GermanPeruvianPimaPolishPortuguesePotawatomiPuebloPuerto RicanPuget Sound SalishRomanianRussianSalvadoranSamoanScandinavianScotch-IrishScottishSeminoleSenegaleseSerbianShoshoneSierra LeoneanSiouxSlavicSlovakSloveneSomaliSouth AfricanSouth AmericanSouth American IndianSoviet UnionSpaniardSpanishSpanish AmericanSpanish American IndianSri LankanSubsaharan AfricanSudaneseSwedishSwissSyrianTaiwaneseThaiTlingit-HaidaTohono O'OdhamTonganTrinidadian and TobagonianTsimshianTurkishU.S. Virgin IslanderUgandanUkrainianUruguayanUteVenezuelanVietnameseWelshWest IndianYakamaYaquiYugoslavianYumanYup'ikZimbabwean
Immigration
NonimmigrantsImmigrantsAfghanistanAfricaAlbaniaArgentinaArmeniaAsiaAustraliaAustriaBahamasBangladeshBarbadosBelarusBelgiumBelizeBoliviaBosnia and HerzegovinaBrazilBulgariaBurma/MyanmarCabo VerdeCambodiaCameroonCanadaCaribbeanCentral AmericaChileChinaColombiaCongoCosta RicaCroatiaCubaCzechoslovakiaDenmarkDominicaDominican RepublicEastern AfricaEastern AsiaEastern EuropeEcuadorEgyptEl SalvadorEnglandEritreaEthiopiaEuropeFijiFranceGermanyGhanaGreeceGrenadaGuatemalaGuyanaHaitiHondurasHong KongHungaryIndiaIndonesiaIranIraqIrelandIsraelItalyJamaicaJapanJordanKazakhstanKenyaKoreaKuwaitLaosLatin AmericaLatviaLebanonLiberiaLithuaniaMalaysiaMexicoMicronesiaMiddle AfricaMoldovaMoroccoNepalNetherlandsNicaraguaNigeriaNorth AmericaNorth MacedoniaNorthern AfricaNorthern EuropeNorwayOceaniaPakistanPanamaPeruPhilippinesPolandPortugalRomaniaRussiaSaudi ArabiaScotlandSenegalSerbiaSierra LeoneSingaporeSomaliaSouth AfricaSouth AmericaSouth Central AsiaSouth Eastern AsiaSouthern EuropeSpainSri LankaSt. Vincent and the GrenadinesSudanSwedenSwitzerlandSyriaTaiwanThailandTrinidad and TobagoTurkeyUgandaUkraineUruguayUzbekistanVenezuelaVietnamWest IndiesWestern AfricaWestern AsiaWestern EuropeYemenZaireZimbabweAzores
Currently Married
Income
Poverty
Unemployment
Labor Participation
Family Structure
Vehicle Availability
Education Level
Disability

Currently Married Comparison

Czechoslovakians

Immigrants from Bolivia

Exceptional
Exceptional
48.8%
CURRENTLY MARRIED
99.4/ 100
METRIC RATING
38th/ 347
METRIC RANK
47.9%
CURRENTLY MARRIED
95.6/ 100
METRIC RATING
91st/ 347
METRIC RANK

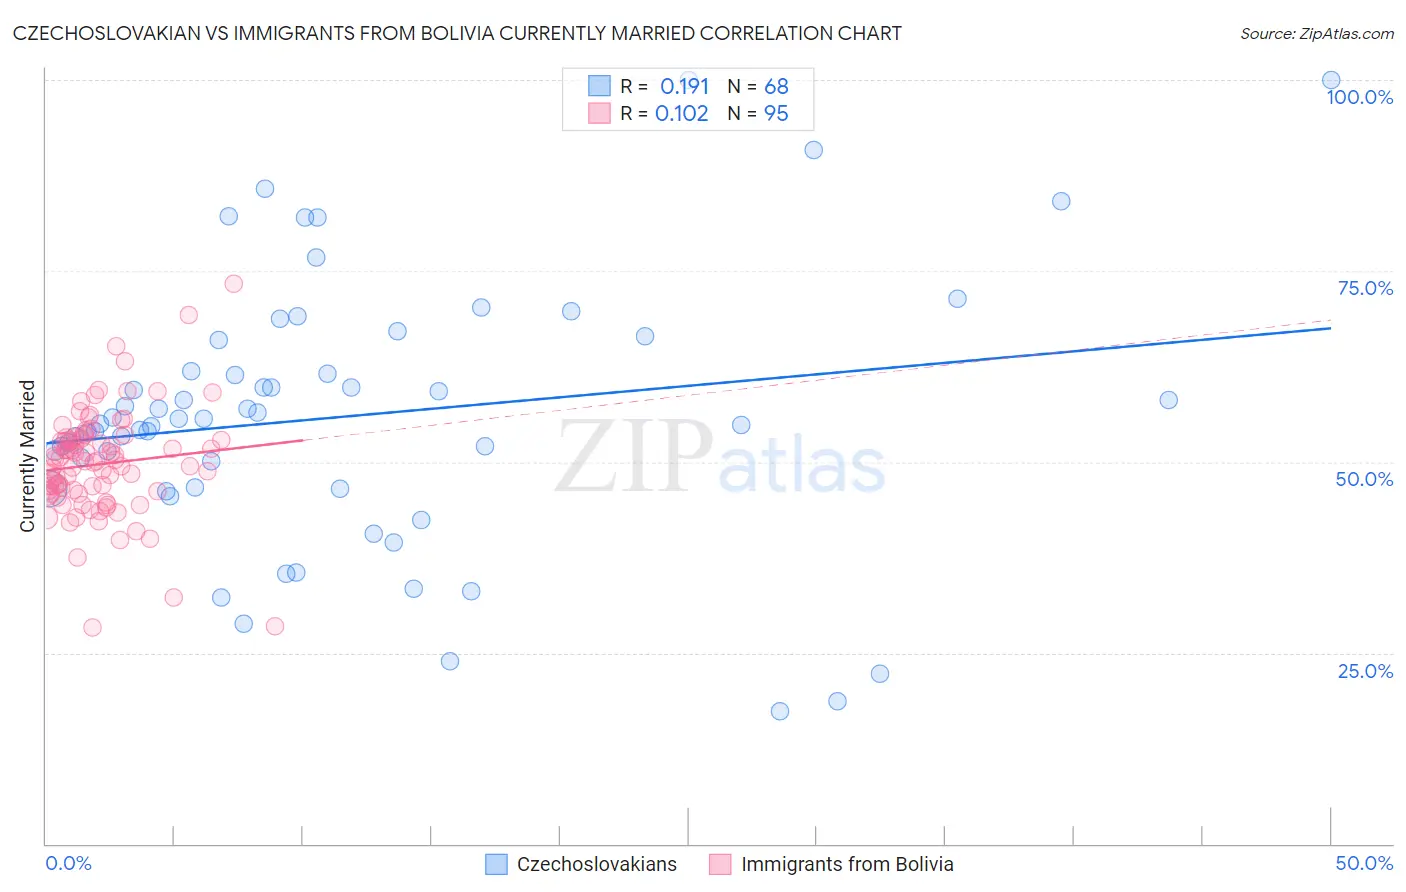
Czechoslovakian vs Immigrants from Bolivia Currently Married Correlation Chart

The statistical analysis conducted on geographies consisting of 368,635,685 people shows a poor positive correlation between the proportion of Czechoslovakians and percentage of population currently married in the United States with a correlation coefficient (R) of 0.191 and weighted average of 48.8%. Similarly, the statistical analysis conducted on geographies consisting of 158,725,888 people shows a poor positive correlation between the proportion of Immigrants from Bolivia and percentage of population currently married in the United States with a correlation coefficient (R) of 0.102 and weighted average of 47.9%, a difference of 1.8%.
Czechoslovakian vs Immigrants from Bolivia Currently Married

Currently Married Correlation Summary

MeasurementCzechoslovakianImmigrants from Bolivia
Minimum17.3%28.3%
Maximum100.0%73.4%
Range82.7%45.1%
Mean56.0%49.7%
Median55.3%50.0%
Interquartile 25% (IQ1)46.6%45.9%
Interquartile 75% (IQ3)63.9%53.1%
Interquartile Range (IQR)17.3%7.2%
Standard Deviation (Sample)17.4%7.0%
Standard Deviation (Population)17.3%7.0%

Similar Demographics by Currently Married

Demographics Similar to Czechoslovakians by Currently Married

In terms of currently married, the demographic groups most similar to Czechoslovakians are British (48.8%, a difference of 0.030%), Italian (48.8%, a difference of 0.040%), Hungarian (48.8%, a difference of 0.040%), Immigrants from Northern Europe (48.8%, a difference of 0.050%), and Immigrants from Canada (48.8%, a difference of 0.050%).
DemographicsRating | RankCurrently Married
Poles
99.5
/100
|
#31
Exceptional
48.9%
Immigrants | Hong Kong
99.5
/100
|
#32
Exceptional
48.9%
Irish
99.5
/100
|
#33
Exceptional
48.9%
Immigrants | Lithuania
99.4
/100
|
#34
Exceptional
48.8%
Immigrants | Northern Europe
99.4
/100
|
#35
Exceptional
48.8%
Italians
99.4
/100
|
#36
Exceptional
48.8%
Hungarians
99.4
/100
|
#37
Exceptional
48.8%
Czechoslovakians
99.4
/100
|
#38
Exceptional
48.8%
British
99.4
/100
|
#39
Exceptional
48.8%
Immigrants | Canada
99.4
/100
|
#40
Exceptional
48.8%
Greeks
99.3
/100
|
#41
Exceptional
48.8%
Finns
99.3
/100
|
#42
Exceptional
48.8%
Scotch-Irish
99.3
/100
|
#43
Exceptional
48.7%
Immigrants | North America
99.3
/100
|
#44
Exceptional
48.7%
Belgians
99.3
/100
|
#45
Exceptional
48.7%

Demographics Similar to Immigrants from Bolivia by Currently Married

In terms of currently married, the demographic groups most similar to Immigrants from Bolivia are American (48.0%, a difference of 0.030%), Korean (47.9%, a difference of 0.040%), Indian (Asian) (48.0%, a difference of 0.050%), Lebanese (47.9%, a difference of 0.090%), and Native Hawaiian (47.9%, a difference of 0.11%).
DemographicsRating | RankCurrently Married
Immigrants | Israel
96.9
/100
|
#84
Exceptional
48.1%
French Canadians
96.3
/100
|
#85
Exceptional
48.0%
Immigrants | Japan
96.2
/100
|
#86
Exceptional
48.0%
Jordanians
96.2
/100
|
#87
Exceptional
48.0%
Immigrants | Eastern Europe
96.1
/100
|
#88
Exceptional
48.0%
Indians (Asian)
95.8
/100
|
#89
Exceptional
48.0%
Americans
95.7
/100
|
#90
Exceptional
48.0%
Immigrants | Bolivia
95.6
/100
|
#91
Exceptional
47.9%
Koreans
95.4
/100
|
#92
Exceptional
47.9%
Lebanese
95.1
/100
|
#93
Exceptional
47.9%
Native Hawaiians
95.0
/100
|
#94
Exceptional
47.9%
Immigrants | Bulgaria
94.8
/100
|
#95
Exceptional
47.9%
Egyptians
94.8
/100
|
#96
Exceptional
47.9%
Immigrants | Ukraine
94.8
/100
|
#97
Exceptional
47.9%
Immigrants | China
94.7
/100
|
#98
Exceptional
47.9%