Immigrants from Syria vs Immigrants from Kuwait Currently Married
COMPARE
Immigrants from Syria
Immigrants from Kuwait
Currently Married
Currently Married Comparison
Immigrants from Syria
Immigrants from Kuwait
46.8%
CURRENTLY MARRIED
59.3/ 100
METRIC RATING
166th/ 347
METRIC RANK
46.1%
CURRENTLY MARRIED
21.7/ 100
METRIC RATING
197th/ 347
METRIC RANK
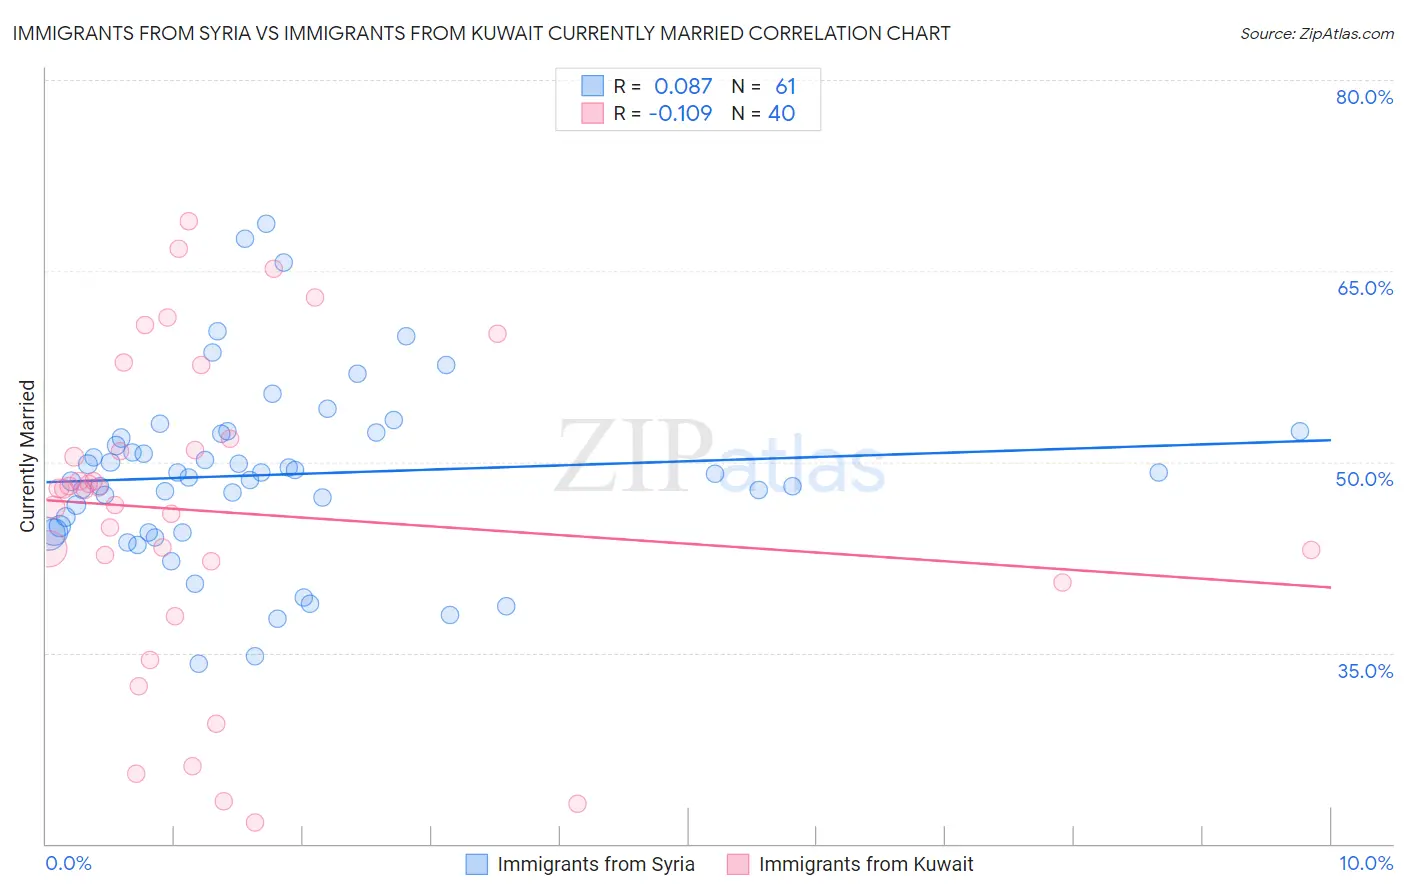
Immigrants from Syria vs Immigrants from Kuwait Currently Married Correlation Chart
The statistical analysis conducted on geographies consisting of 174,114,575 people shows a slight positive correlation between the proportion of Immigrants from Syria and percentage of population currently married in the United States with a correlation coefficient (R) of 0.087 and weighted average of 46.8%. Similarly, the statistical analysis conducted on geographies consisting of 136,899,142 people shows a poor negative correlation between the proportion of Immigrants from Kuwait and percentage of population currently married in the United States with a correlation coefficient (R) of -0.109 and weighted average of 46.1%, a difference of 1.5%.
Currently Married Correlation Summary
| Measurement | Immigrants from Syria | Immigrants from Kuwait |
| Minimum | 34.1% | 21.7% |
| Maximum | 68.7% | 68.9% |
| Range | 34.6% | 47.2% |
| Mean | 49.0% | 46.1% |
| Median | 49.1% | 47.8% |
| Interquartile 25% (IQ1) | 44.5% | 41.4% |
| Interquartile 75% (IQ3) | 52.2% | 51.4% |
| Interquartile Range (IQR) | 7.8% | 10.0% |
| Standard Deviation (Sample) | 7.0% | 12.3% |
| Standard Deviation (Population) | 7.0% | 12.1% |
Similar Demographics by Currently Married
Demographics Similar to Immigrants from Syria by Currently Married
In terms of currently married, the demographic groups most similar to Immigrants from Syria are Samoan (46.8%, a difference of 0.020%), Spaniard (46.8%, a difference of 0.020%), Immigrants from Afghanistan (46.8%, a difference of 0.040%), Armenian (46.8%, a difference of 0.040%), and Immigrants from Latvia (46.7%, a difference of 0.10%).
| Demographics | Rating | Rank | Currently Married |
| Iraqis | 66.4 /100 | #159 | Good 46.9% |
| Immigrants | Uzbekistan | 66.0 /100 | #160 | Good 46.9% |
| Immigrants | Southern Europe | 65.9 /100 | #161 | Good 46.9% |
| Immigrants | Nonimmigrants | 65.4 /100 | #162 | Good 46.9% |
| Delaware | 64.7 /100 | #163 | Good 46.9% |
| Immigrants | Western Asia | 64.2 /100 | #164 | Good 46.9% |
| Samoans | 59.8 /100 | #165 | Average 46.8% |
| Immigrants | Syria | 59.3 /100 | #166 | Average 46.8% |
| Spaniards | 58.8 /100 | #167 | Average 46.8% |
| Immigrants | Afghanistan | 58.2 /100 | #168 | Average 46.8% |
| Armenians | 58.2 /100 | #169 | Average 46.8% |
| Immigrants | Latvia | 56.7 /100 | #170 | Average 46.7% |
| Immigrants | Zimbabwe | 52.4 /100 | #171 | Average 46.7% |
| Aleuts | 52.0 /100 | #172 | Average 46.7% |
| Tlingit-Haida | 51.2 /100 | #173 | Average 46.7% |
Demographics Similar to Immigrants from Kuwait by Currently Married
In terms of currently married, the demographic groups most similar to Immigrants from Kuwait are Immigrants from Bosnia and Herzegovina (46.1%, a difference of 0.030%), Immigrants from Colombia (46.1%, a difference of 0.040%), Immigrants from Nepal (46.1%, a difference of 0.10%), South American (46.1%, a difference of 0.11%), and Immigrants from Costa Rica (46.0%, a difference of 0.12%).
| Demographics | Rating | Rank | Currently Married |
| Choctaw | 29.1 /100 | #190 | Fair 46.3% |
| Immigrants | France | 27.7 /100 | #191 | Fair 46.2% |
| Soviet Union | 25.7 /100 | #192 | Fair 46.2% |
| Immigrants | Fiji | 25.0 /100 | #193 | Fair 46.2% |
| South Americans | 23.8 /100 | #194 | Fair 46.1% |
| Immigrants | Nepal | 23.7 /100 | #195 | Fair 46.1% |
| Immigrants | Bosnia and Herzegovina | 22.2 /100 | #196 | Fair 46.1% |
| Immigrants | Kuwait | 21.7 /100 | #197 | Fair 46.1% |
| Immigrants | Colombia | 21.0 /100 | #198 | Fair 46.1% |
| Immigrants | Costa Rica | 19.6 /100 | #199 | Poor 46.0% |
| Creek | 17.2 /100 | #200 | Poor 46.0% |
| Malaysians | 15.3 /100 | #201 | Poor 45.9% |
| Immigrants | Albania | 14.5 /100 | #202 | Poor 45.9% |
| Taiwanese | 11.7 /100 | #203 | Poor 45.8% |
| Immigrants | Spain | 11.6 /100 | #204 | Poor 45.8% |