Cypriot vs Immigrants from Ecuador Divorced or Separated
COMPARE
Cypriot
Immigrants from Ecuador
Divorced or Separated
Divorced or Separated Comparison
Cypriots
Immigrants from Ecuador
10.5%
DIVORCED OR SEPARATED
100.0/ 100
METRIC RATING
13th/ 347
METRIC RANK
11.8%
DIVORCED OR SEPARATED
88.9/ 100
METRIC RATING
128th/ 347
METRIC RANK
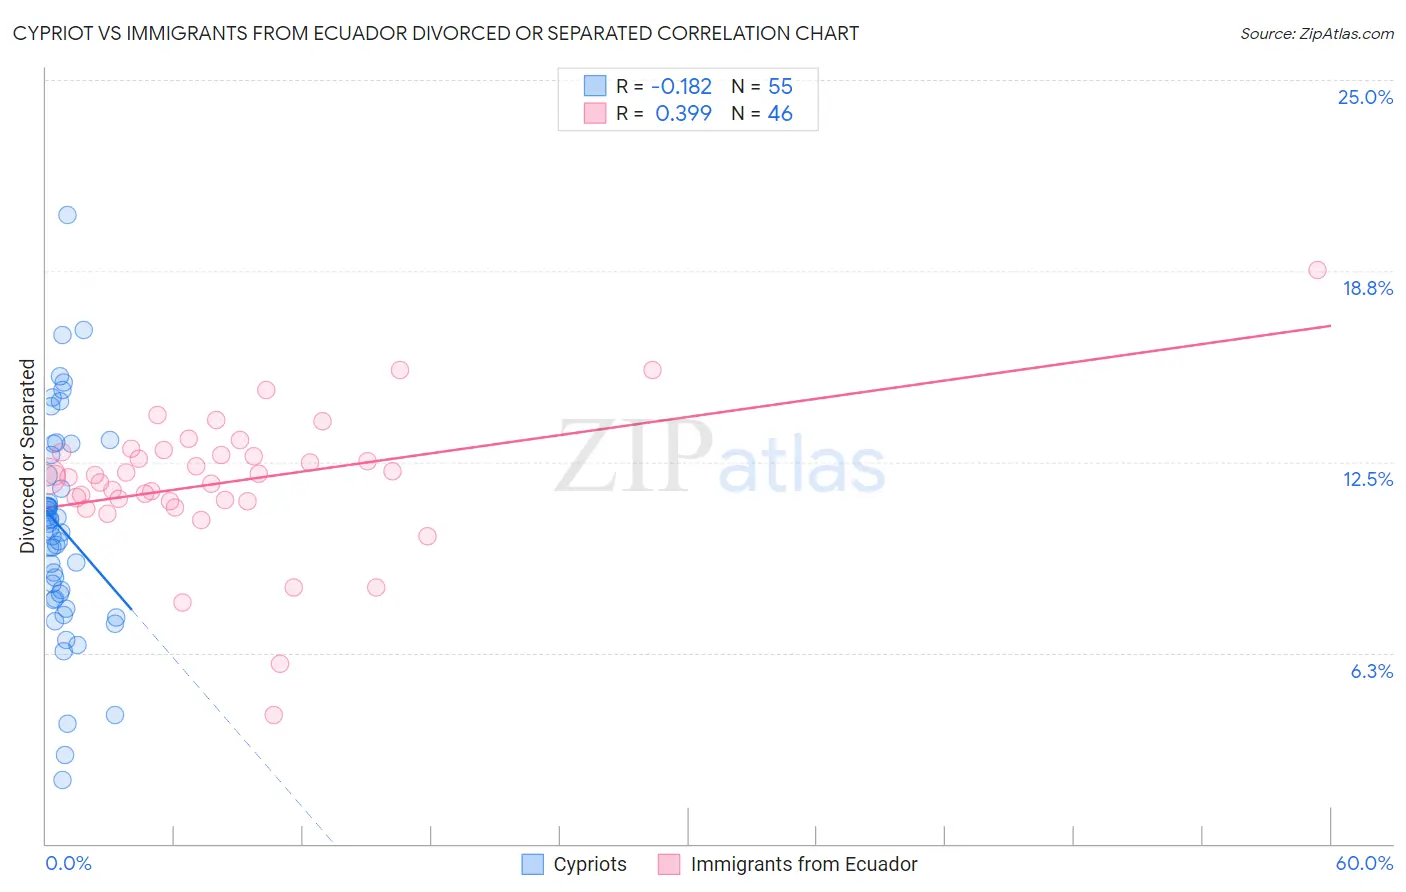
Cypriot vs Immigrants from Ecuador Divorced or Separated Correlation Chart
The statistical analysis conducted on geographies consisting of 61,840,758 people shows a poor negative correlation between the proportion of Cypriots and percentage of population currently divorced or separated in the United States with a correlation coefficient (R) of -0.182 and weighted average of 10.5%. Similarly, the statistical analysis conducted on geographies consisting of 270,954,904 people shows a mild positive correlation between the proportion of Immigrants from Ecuador and percentage of population currently divorced or separated in the United States with a correlation coefficient (R) of 0.399 and weighted average of 11.8%, a difference of 12.9%.
Divorced or Separated Correlation Summary
| Measurement | Cypriot | Immigrants from Ecuador |
| Minimum | 2.1% | 4.2% |
| Maximum | 20.6% | 18.8% |
| Range | 18.5% | 14.6% |
| Mean | 10.3% | 11.9% |
| Median | 10.3% | 12.0% |
| Interquartile 25% (IQ1) | 8.0% | 11.2% |
| Interquartile 75% (IQ3) | 12.7% | 12.8% |
| Interquartile Range (IQR) | 4.7% | 1.6% |
| Standard Deviation (Sample) | 3.5% | 2.4% |
| Standard Deviation (Population) | 3.5% | 2.3% |
Similar Demographics by Divorced or Separated
Demographics Similar to Cypriots by Divorced or Separated
In terms of divorced or separated, the demographic groups most similar to Cypriots are Okinawan (10.5%, a difference of 0.16%), Immigrants from South Central Asia (10.4%, a difference of 0.49%), Assyrian/Chaldean/Syriac (10.6%, a difference of 0.74%), Immigrants from Armenia (10.6%, a difference of 0.81%), and Immigrants from Korea (10.6%, a difference of 1.3%).
| Demographics | Rating | Rank | Divorced or Separated |
| Indians (Asian) | 100.0 /100 | #6 | Exceptional 10.2% |
| Thais | 100.0 /100 | #7 | Exceptional 10.2% |
| Immigrants | Eastern Asia | 100.0 /100 | #8 | Exceptional 10.2% |
| Yup'ik | 100.0 /100 | #9 | Exceptional 10.3% |
| Immigrants | Singapore | 100.0 /100 | #10 | Exceptional 10.3% |
| Immigrants | South Central Asia | 100.0 /100 | #11 | Exceptional 10.4% |
| Okinawans | 100.0 /100 | #12 | Exceptional 10.5% |
| Cypriots | 100.0 /100 | #13 | Exceptional 10.5% |
| Assyrians/Chaldeans/Syriacs | 100.0 /100 | #14 | Exceptional 10.6% |
| Immigrants | Armenia | 100.0 /100 | #15 | Exceptional 10.6% |
| Immigrants | Korea | 100.0 /100 | #16 | Exceptional 10.6% |
| Immigrants | Israel | 100.0 /100 | #17 | Exceptional 10.6% |
| Immigrants | Iran | 100.0 /100 | #18 | Exceptional 10.6% |
| Asians | 100.0 /100 | #19 | Exceptional 10.6% |
| Burmese | 100.0 /100 | #20 | Exceptional 10.7% |
Demographics Similar to Immigrants from Ecuador by Divorced or Separated
In terms of divorced or separated, the demographic groups most similar to Immigrants from Ecuador are South African (11.8%, a difference of 0.0%), Immigrants from St. Vincent and the Grenadines (11.8%, a difference of 0.040%), Immigrants from Austria (11.8%, a difference of 0.050%), Immigrants from Cambodia (11.8%, a difference of 0.060%), and Immigrants from Afghanistan (11.8%, a difference of 0.080%).
| Demographics | Rating | Rank | Divorced or Separated |
| Romanians | 94.5 /100 | #121 | Exceptional 11.8% |
| Menominee | 93.8 /100 | #122 | Exceptional 11.8% |
| Immigrants | Immigrants | 93.7 /100 | #123 | Exceptional 11.8% |
| Ugandans | 93.1 /100 | #124 | Exceptional 11.8% |
| Ukrainians | 92.3 /100 | #125 | Exceptional 11.8% |
| South American Indians | 92.1 /100 | #126 | Exceptional 11.8% |
| South Africans | 88.9 /100 | #127 | Excellent 11.8% |
| Immigrants | Ecuador | 88.9 /100 | #128 | Excellent 11.8% |
| Immigrants | St. Vincent and the Grenadines | 88.4 /100 | #129 | Excellent 11.8% |
| Immigrants | Austria | 88.2 /100 | #130 | Excellent 11.8% |
| Immigrants | Cambodia | 88.2 /100 | #131 | Excellent 11.8% |
| Immigrants | Afghanistan | 87.9 /100 | #132 | Excellent 11.8% |
| New Zealanders | 87.5 /100 | #133 | Excellent 11.9% |
| Argentineans | 85.1 /100 | #134 | Excellent 11.9% |
| Danes | 84.8 /100 | #135 | Excellent 11.9% |