Cypriot vs Peruvian Divorced or Separated
COMPARE
Cypriot
Peruvian
Divorced or Separated
Divorced or Separated Comparison
Cypriots
Peruvians
10.5%
DIVORCED OR SEPARATED
100.0/ 100
METRIC RATING
13th/ 347
METRIC RANK
11.9%
DIVORCED OR SEPARATED
80.9/ 100
METRIC RATING
144th/ 347
METRIC RANK
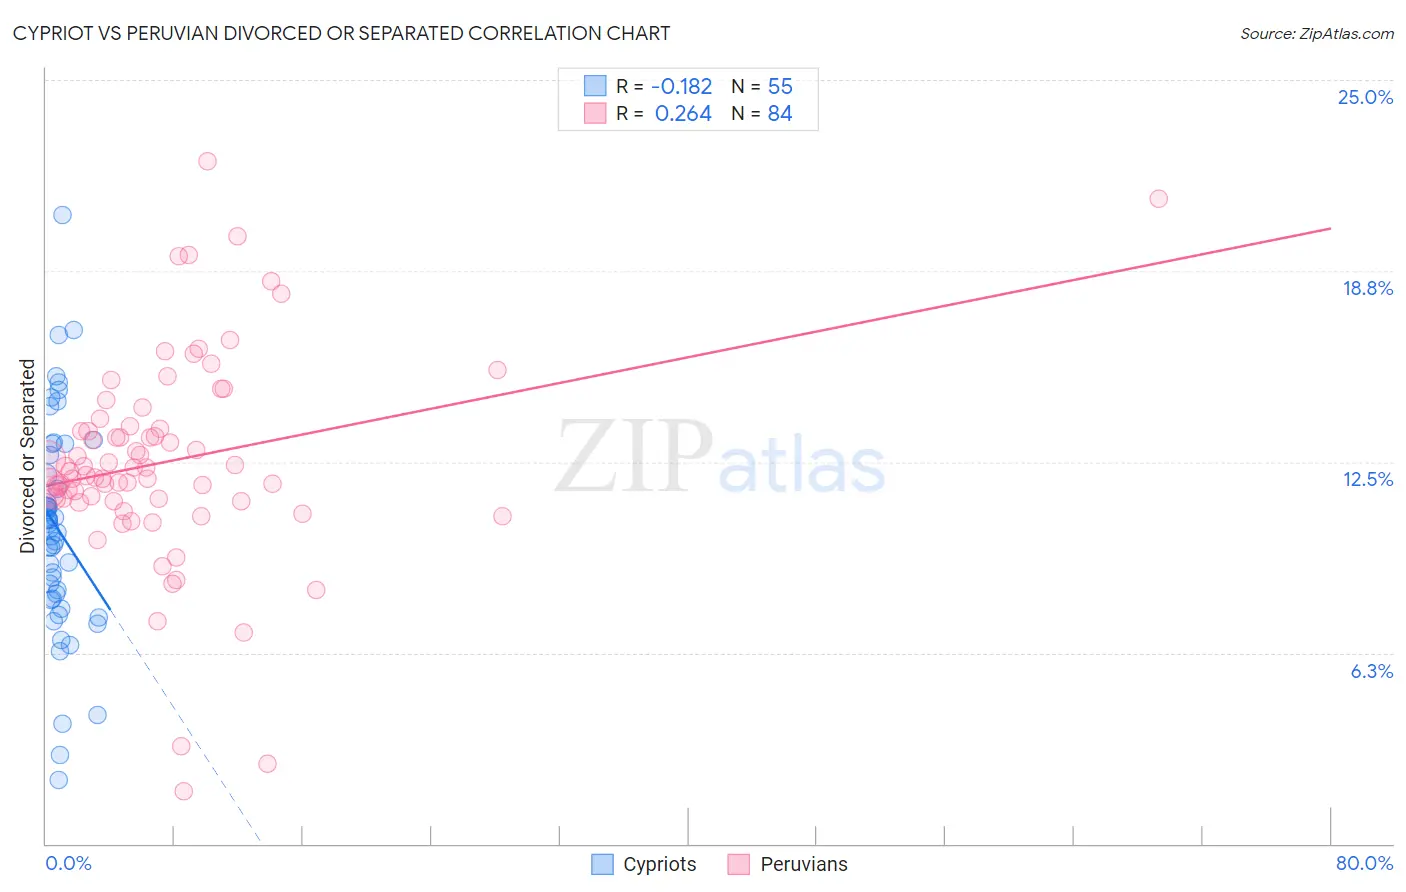
Cypriot vs Peruvian Divorced or Separated Correlation Chart
The statistical analysis conducted on geographies consisting of 61,840,758 people shows a poor negative correlation between the proportion of Cypriots and percentage of population currently divorced or separated in the United States with a correlation coefficient (R) of -0.182 and weighted average of 10.5%. Similarly, the statistical analysis conducted on geographies consisting of 363,080,575 people shows a weak positive correlation between the proportion of Peruvians and percentage of population currently divorced or separated in the United States with a correlation coefficient (R) of 0.264 and weighted average of 11.9%, a difference of 13.6%.
Divorced or Separated Correlation Summary
| Measurement | Cypriot | Peruvian |
| Minimum | 2.1% | 1.7% |
| Maximum | 20.6% | 22.4% |
| Range | 18.5% | 20.7% |
| Mean | 10.3% | 12.5% |
| Median | 10.3% | 12.1% |
| Interquartile 25% (IQ1) | 8.0% | 11.3% |
| Interquartile 75% (IQ3) | 12.7% | 13.6% |
| Interquartile Range (IQR) | 4.7% | 2.4% |
| Standard Deviation (Sample) | 3.5% | 3.4% |
| Standard Deviation (Population) | 3.5% | 3.4% |
Similar Demographics by Divorced or Separated
Demographics Similar to Cypriots by Divorced or Separated
In terms of divorced or separated, the demographic groups most similar to Cypriots are Okinawan (10.5%, a difference of 0.16%), Immigrants from South Central Asia (10.4%, a difference of 0.49%), Assyrian/Chaldean/Syriac (10.6%, a difference of 0.74%), Immigrants from Armenia (10.6%, a difference of 0.81%), and Immigrants from Korea (10.6%, a difference of 1.3%).
| Demographics | Rating | Rank | Divorced or Separated |
| Indians (Asian) | 100.0 /100 | #6 | Exceptional 10.2% |
| Thais | 100.0 /100 | #7 | Exceptional 10.2% |
| Immigrants | Eastern Asia | 100.0 /100 | #8 | Exceptional 10.2% |
| Yup'ik | 100.0 /100 | #9 | Exceptional 10.3% |
| Immigrants | Singapore | 100.0 /100 | #10 | Exceptional 10.3% |
| Immigrants | South Central Asia | 100.0 /100 | #11 | Exceptional 10.4% |
| Okinawans | 100.0 /100 | #12 | Exceptional 10.5% |
| Cypriots | 100.0 /100 | #13 | Exceptional 10.5% |
| Assyrians/Chaldeans/Syriacs | 100.0 /100 | #14 | Exceptional 10.6% |
| Immigrants | Armenia | 100.0 /100 | #15 | Exceptional 10.6% |
| Immigrants | Korea | 100.0 /100 | #16 | Exceptional 10.6% |
| Immigrants | Israel | 100.0 /100 | #17 | Exceptional 10.6% |
| Immigrants | Iran | 100.0 /100 | #18 | Exceptional 10.6% |
| Asians | 100.0 /100 | #19 | Exceptional 10.6% |
| Burmese | 100.0 /100 | #20 | Exceptional 10.7% |
Demographics Similar to Peruvians by Divorced or Separated
In terms of divorced or separated, the demographic groups most similar to Peruvians are Croatian (11.9%, a difference of 0.020%), Immigrants from Zimbabwe (11.9%, a difference of 0.030%), Pakistani (11.9%, a difference of 0.030%), Immigrants from Grenada (11.9%, a difference of 0.10%), and Immigrants from Morocco (11.9%, a difference of 0.12%).
| Demographics | Rating | Rank | Divorced or Separated |
| Alsatians | 84.0 /100 | #137 | Excellent 11.9% |
| Immigrants | Netherlands | 83.9 /100 | #138 | Excellent 11.9% |
| Australians | 83.6 /100 | #139 | Excellent 11.9% |
| Lebanese | 83.4 /100 | #140 | Excellent 11.9% |
| Immigrants | Morocco | 82.9 /100 | #141 | Excellent 11.9% |
| Immigrants | Zimbabwe | 81.5 /100 | #142 | Excellent 11.9% |
| Pakistanis | 81.3 /100 | #143 | Excellent 11.9% |
| Peruvians | 80.9 /100 | #144 | Excellent 11.9% |
| Croatians | 80.6 /100 | #145 | Excellent 11.9% |
| Immigrants | Grenada | 79.1 /100 | #146 | Good 11.9% |
| Poles | 78.6 /100 | #147 | Good 11.9% |
| Italians | 77.8 /100 | #148 | Good 11.9% |
| Immigrants | Oceania | 77.7 /100 | #149 | Good 11.9% |
| Immigrants | Portugal | 77.3 /100 | #150 | Good 11.9% |
| Czechs | 76.4 /100 | #151 | Good 11.9% |