Cypriot vs Nigerian Divorced or Separated
COMPARE
Cypriot
Nigerian
Divorced or Separated
Divorced or Separated Comparison
Cypriots
Nigerians
10.5%
DIVORCED OR SEPARATED
100.0/ 100
METRIC RATING
13th/ 347
METRIC RANK
12.1%
DIVORCED OR SEPARATED
30.1/ 100
METRIC RATING
198th/ 347
METRIC RANK
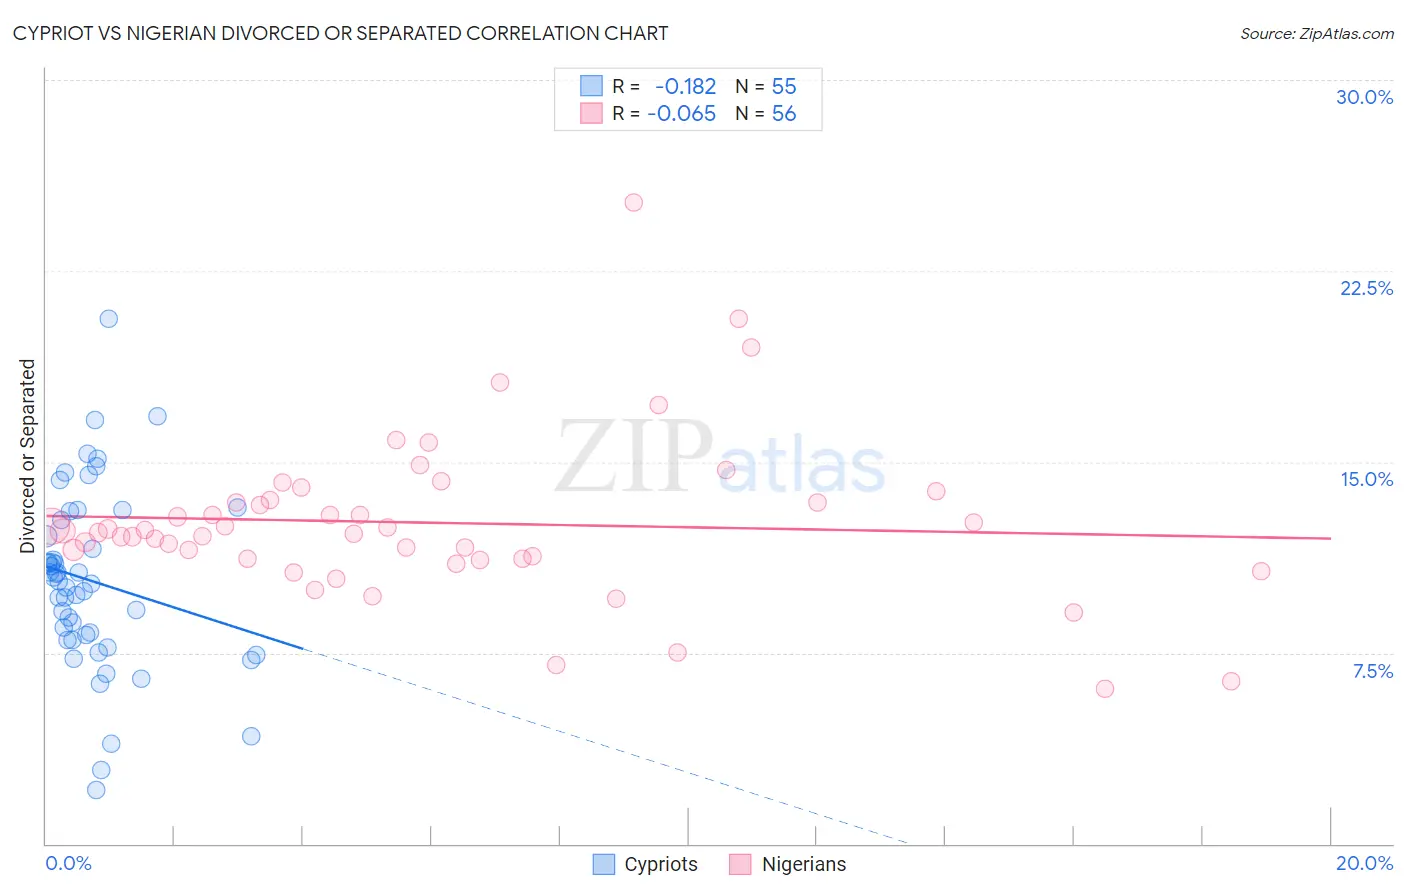
Cypriot vs Nigerian Divorced or Separated Correlation Chart
The statistical analysis conducted on geographies consisting of 61,840,758 people shows a poor negative correlation between the proportion of Cypriots and percentage of population currently divorced or separated in the United States with a correlation coefficient (R) of -0.182 and weighted average of 10.5%. Similarly, the statistical analysis conducted on geographies consisting of 332,564,153 people shows a slight negative correlation between the proportion of Nigerians and percentage of population currently divorced or separated in the United States with a correlation coefficient (R) of -0.065 and weighted average of 12.1%, a difference of 15.9%.
Divorced or Separated Correlation Summary
| Measurement | Cypriot | Nigerian |
| Minimum | 2.1% | 6.1% |
| Maximum | 20.6% | 25.2% |
| Range | 18.5% | 19.1% |
| Mean | 10.3% | 12.6% |
| Median | 10.3% | 12.2% |
| Interquartile 25% (IQ1) | 8.0% | 11.2% |
| Interquartile 75% (IQ3) | 12.7% | 13.5% |
| Interquartile Range (IQR) | 4.7% | 2.3% |
| Standard Deviation (Sample) | 3.5% | 3.2% |
| Standard Deviation (Population) | 3.5% | 3.2% |
Similar Demographics by Divorced or Separated
Demographics Similar to Cypriots by Divorced or Separated
In terms of divorced or separated, the demographic groups most similar to Cypriots are Okinawan (10.5%, a difference of 0.16%), Immigrants from South Central Asia (10.4%, a difference of 0.49%), Assyrian/Chaldean/Syriac (10.6%, a difference of 0.74%), Immigrants from Armenia (10.6%, a difference of 0.81%), and Immigrants from Korea (10.6%, a difference of 1.3%).
| Demographics | Rating | Rank | Divorced or Separated |
| Indians (Asian) | 100.0 /100 | #6 | Exceptional 10.2% |
| Thais | 100.0 /100 | #7 | Exceptional 10.2% |
| Immigrants | Eastern Asia | 100.0 /100 | #8 | Exceptional 10.2% |
| Yup'ik | 100.0 /100 | #9 | Exceptional 10.3% |
| Immigrants | Singapore | 100.0 /100 | #10 | Exceptional 10.3% |
| Immigrants | South Central Asia | 100.0 /100 | #11 | Exceptional 10.4% |
| Okinawans | 100.0 /100 | #12 | Exceptional 10.5% |
| Cypriots | 100.0 /100 | #13 | Exceptional 10.5% |
| Assyrians/Chaldeans/Syriacs | 100.0 /100 | #14 | Exceptional 10.6% |
| Immigrants | Armenia | 100.0 /100 | #15 | Exceptional 10.6% |
| Immigrants | Korea | 100.0 /100 | #16 | Exceptional 10.6% |
| Immigrants | Israel | 100.0 /100 | #17 | Exceptional 10.6% |
| Immigrants | Iran | 100.0 /100 | #18 | Exceptional 10.6% |
| Asians | 100.0 /100 | #19 | Exceptional 10.6% |
| Burmese | 100.0 /100 | #20 | Exceptional 10.7% |
Demographics Similar to Nigerians by Divorced or Separated
In terms of divorced or separated, the demographic groups most similar to Nigerians are Immigrants from Burma/Myanmar (12.1%, a difference of 0.010%), Immigrants from Africa (12.1%, a difference of 0.010%), Central American (12.1%, a difference of 0.030%), Immigrants from England (12.1%, a difference of 0.050%), and South American (12.2%, a difference of 0.060%).
| Demographics | Rating | Rank | Divorced or Separated |
| Swedes | 34.4 /100 | #191 | Fair 12.1% |
| Norwegians | 33.2 /100 | #192 | Fair 12.1% |
| Immigrants | Thailand | 32.5 /100 | #193 | Fair 12.1% |
| Immigrants | Eritrea | 31.9 /100 | #194 | Fair 12.1% |
| Immigrants | England | 31.4 /100 | #195 | Fair 12.1% |
| Immigrants | Burma/Myanmar | 30.4 /100 | #196 | Fair 12.1% |
| Immigrants | Africa | 30.3 /100 | #197 | Fair 12.1% |
| Nigerians | 30.1 /100 | #198 | Fair 12.1% |
| Central Americans | 29.4 /100 | #199 | Fair 12.1% |
| South Americans | 28.6 /100 | #200 | Fair 12.2% |
| Guatemalans | 26.9 /100 | #201 | Fair 12.2% |
| Portuguese | 23.5 /100 | #202 | Fair 12.2% |
| Immigrants | Guatemala | 23.2 /100 | #203 | Fair 12.2% |
| Kenyans | 21.8 /100 | #204 | Fair 12.2% |
| Immigrants | Costa Rica | 21.3 /100 | #205 | Fair 12.2% |