Cypriot vs Immigrants from Haiti Divorced or Separated
COMPARE
Cypriot
Immigrants from Haiti
Divorced or Separated
Divorced or Separated Comparison
Cypriots
Immigrants from Haiti
10.5%
DIVORCED OR SEPARATED
100.0/ 100
METRIC RATING
13th/ 347
METRIC RANK
13.4%
DIVORCED OR SEPARATED
0.0/ 100
METRIC RATING
322nd/ 347
METRIC RANK
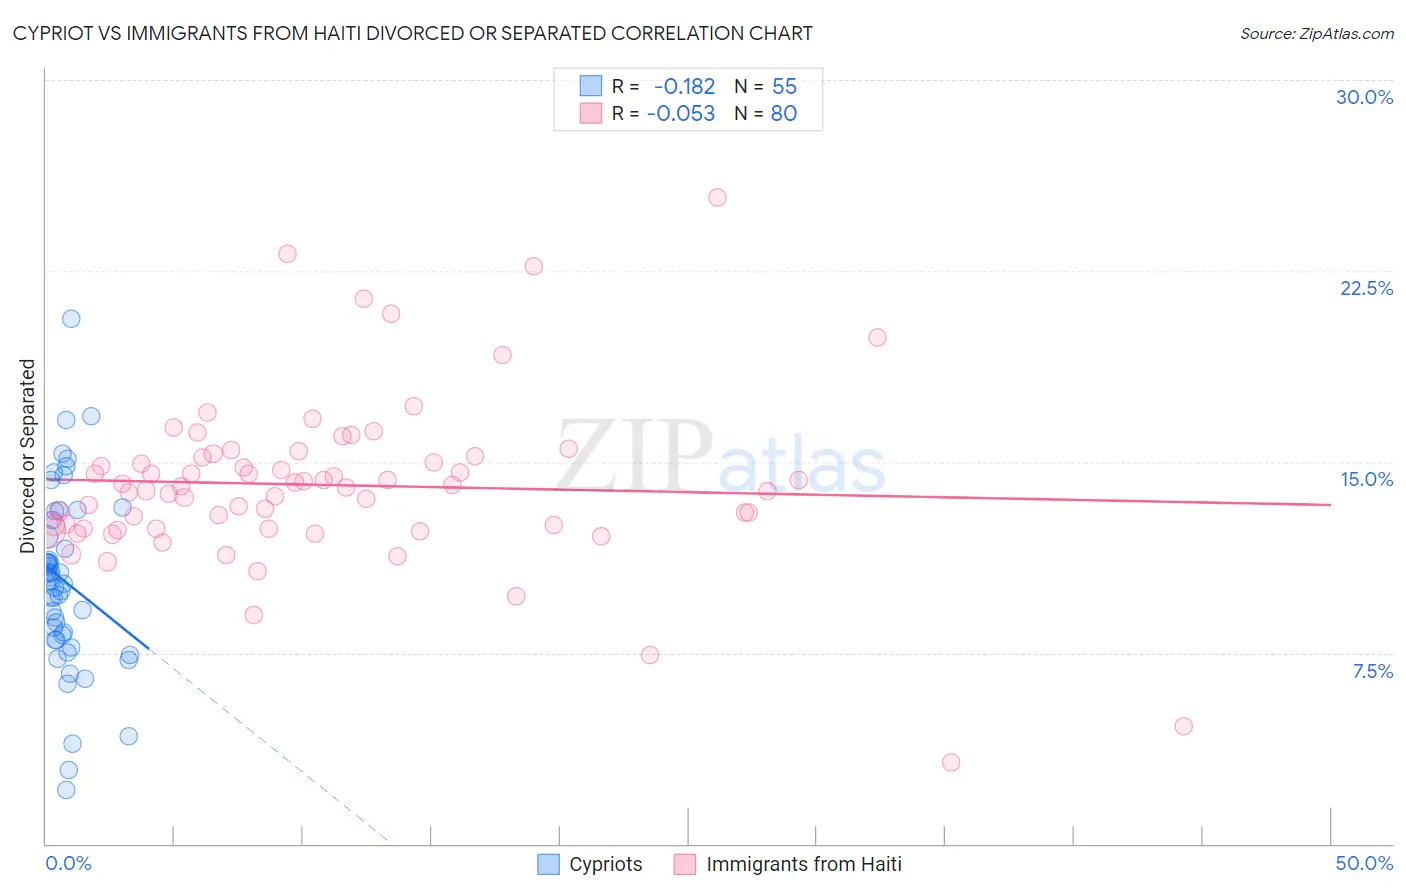
Cypriot vs Immigrants from Haiti Divorced or Separated Correlation Chart
The statistical analysis conducted on geographies consisting of 61,840,758 people shows a poor negative correlation between the proportion of Cypriots and percentage of population currently divorced or separated in the United States with a correlation coefficient (R) of -0.182 and weighted average of 10.5%. Similarly, the statistical analysis conducted on geographies consisting of 225,208,524 people shows a slight negative correlation between the proportion of Immigrants from Haiti and percentage of population currently divorced or separated in the United States with a correlation coefficient (R) of -0.053 and weighted average of 13.4%, a difference of 27.9%.
Divorced or Separated Correlation Summary
| Measurement | Cypriot | Immigrants from Haiti |
| Minimum | 2.1% | 3.2% |
| Maximum | 20.6% | 25.4% |
| Range | 18.5% | 22.2% |
| Mean | 10.3% | 14.1% |
| Median | 10.3% | 14.0% |
| Interquartile 25% (IQ1) | 8.0% | 12.4% |
| Interquartile 75% (IQ3) | 12.7% | 15.2% |
| Interquartile Range (IQR) | 4.7% | 2.8% |
| Standard Deviation (Sample) | 3.5% | 3.4% |
| Standard Deviation (Population) | 3.5% | 3.4% |
Similar Demographics by Divorced or Separated
Demographics Similar to Cypriots by Divorced or Separated
In terms of divorced or separated, the demographic groups most similar to Cypriots are Okinawan (10.5%, a difference of 0.16%), Immigrants from South Central Asia (10.4%, a difference of 0.49%), Assyrian/Chaldean/Syriac (10.6%, a difference of 0.74%), Immigrants from Armenia (10.6%, a difference of 0.81%), and Immigrants from Korea (10.6%, a difference of 1.3%).
| Demographics | Rating | Rank | Divorced or Separated |
| Indians (Asian) | 100.0 /100 | #6 | Exceptional 10.2% |
| Thais | 100.0 /100 | #7 | Exceptional 10.2% |
| Immigrants | Eastern Asia | 100.0 /100 | #8 | Exceptional 10.2% |
| Yup'ik | 100.0 /100 | #9 | Exceptional 10.3% |
| Immigrants | Singapore | 100.0 /100 | #10 | Exceptional 10.3% |
| Immigrants | South Central Asia | 100.0 /100 | #11 | Exceptional 10.4% |
| Okinawans | 100.0 /100 | #12 | Exceptional 10.5% |
| Cypriots | 100.0 /100 | #13 | Exceptional 10.5% |
| Assyrians/Chaldeans/Syriacs | 100.0 /100 | #14 | Exceptional 10.6% |
| Immigrants | Armenia | 100.0 /100 | #15 | Exceptional 10.6% |
| Immigrants | Korea | 100.0 /100 | #16 | Exceptional 10.6% |
| Immigrants | Israel | 100.0 /100 | #17 | Exceptional 10.6% |
| Immigrants | Iran | 100.0 /100 | #18 | Exceptional 10.6% |
| Asians | 100.0 /100 | #19 | Exceptional 10.6% |
| Burmese | 100.0 /100 | #20 | Exceptional 10.7% |
Demographics Similar to Immigrants from Haiti by Divorced or Separated
In terms of divorced or separated, the demographic groups most similar to Immigrants from Haiti are U.S. Virgin Islander (13.4%, a difference of 0.22%), Cheyenne (13.4%, a difference of 0.24%), Osage (13.4%, a difference of 0.29%), Cajun (13.4%, a difference of 0.34%), and Potawatomi (13.5%, a difference of 0.35%).
| Demographics | Rating | Rank | Divorced or Separated |
| Spanish Americans | 0.0 /100 | #315 | Tragic 13.3% |
| Tsimshian | 0.0 /100 | #316 | Tragic 13.3% |
| Haitians | 0.0 /100 | #317 | Tragic 13.3% |
| Cree | 0.0 /100 | #318 | Tragic 13.4% |
| Puget Sound Salish | 0.0 /100 | #319 | Tragic 13.4% |
| Cajuns | 0.0 /100 | #320 | Tragic 13.4% |
| Cheyenne | 0.0 /100 | #321 | Tragic 13.4% |
| Immigrants | Haiti | 0.0 /100 | #322 | Tragic 13.4% |
| U.S. Virgin Islanders | 0.0 /100 | #323 | Tragic 13.4% |
| Osage | 0.0 /100 | #324 | Tragic 13.4% |
| Potawatomi | 0.0 /100 | #325 | Tragic 13.5% |
| Immigrants | Congo | 0.0 /100 | #326 | Tragic 13.5% |
| Comanche | 0.0 /100 | #327 | Tragic 13.5% |
| Immigrants | Caribbean | 0.0 /100 | #328 | Tragic 13.6% |
| Houma | 0.0 /100 | #329 | Tragic 13.6% |