Cypriot vs Romanian Divorced or Separated
COMPARE
Cypriot
Romanian
Divorced or Separated
Divorced or Separated Comparison
Cypriots
Romanians
10.5%
DIVORCED OR SEPARATED
100.0/ 100
METRIC RATING
13th/ 347
METRIC RANK
11.8%
DIVORCED OR SEPARATED
94.5/ 100
METRIC RATING
121st/ 347
METRIC RANK
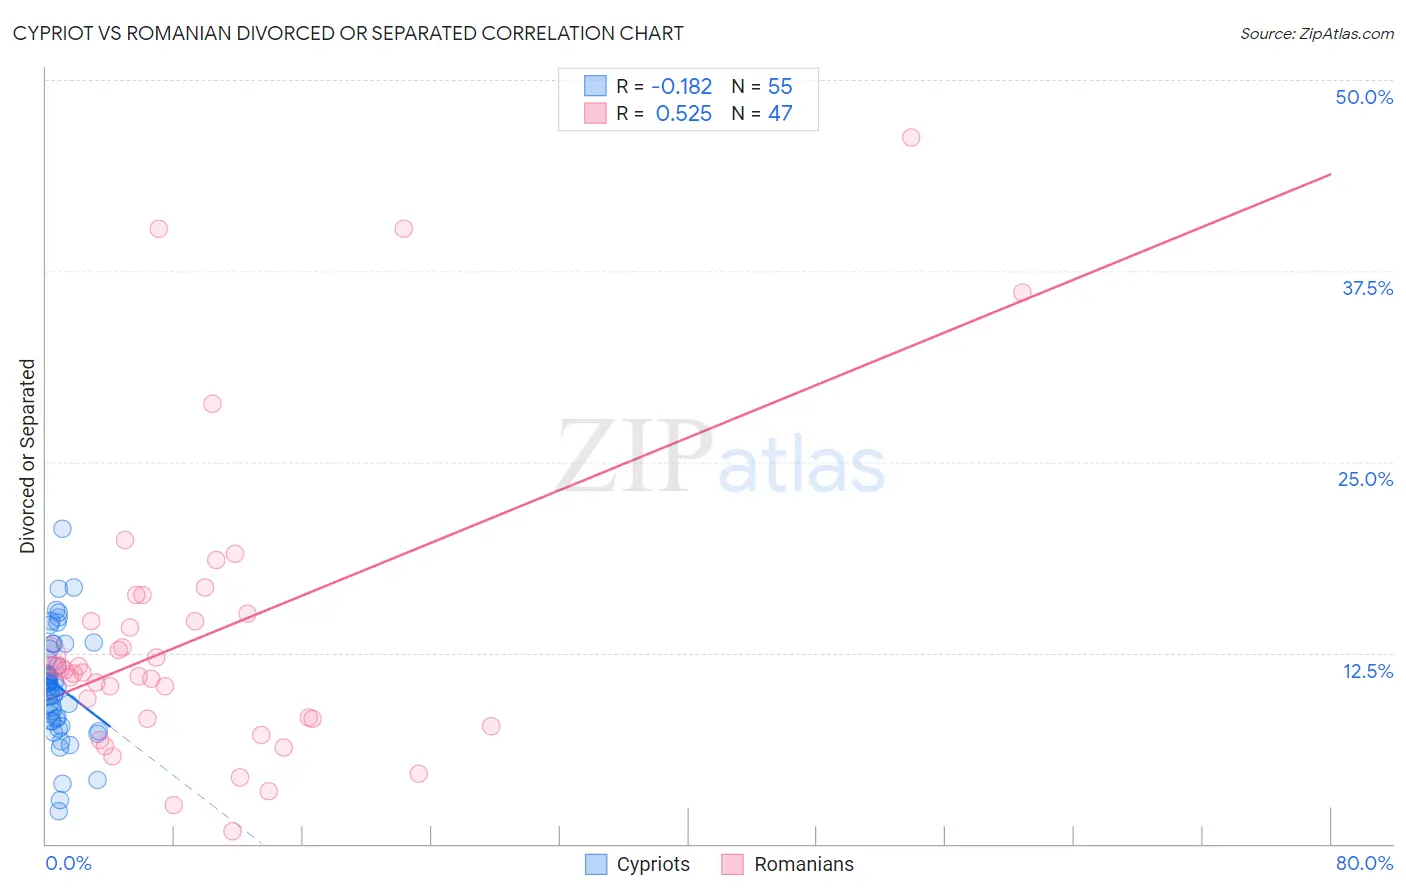
Cypriot vs Romanian Divorced or Separated Correlation Chart
The statistical analysis conducted on geographies consisting of 61,840,758 people shows a poor negative correlation between the proportion of Cypriots and percentage of population currently divorced or separated in the United States with a correlation coefficient (R) of -0.182 and weighted average of 10.5%. Similarly, the statistical analysis conducted on geographies consisting of 377,785,427 people shows a substantial positive correlation between the proportion of Romanians and percentage of population currently divorced or separated in the United States with a correlation coefficient (R) of 0.525 and weighted average of 11.8%, a difference of 12.2%.
Divorced or Separated Correlation Summary
| Measurement | Cypriot | Romanian |
| Minimum | 2.1% | 0.80% |
| Maximum | 20.6% | 46.2% |
| Range | 18.5% | 45.4% |
| Mean | 10.3% | 13.6% |
| Median | 10.3% | 11.4% |
| Interquartile 25% (IQ1) | 8.0% | 8.2% |
| Interquartile 75% (IQ3) | 12.7% | 15.0% |
| Interquartile Range (IQR) | 4.7% | 6.8% |
| Standard Deviation (Sample) | 3.5% | 9.8% |
| Standard Deviation (Population) | 3.5% | 9.7% |
Similar Demographics by Divorced or Separated
Demographics Similar to Cypriots by Divorced or Separated
In terms of divorced or separated, the demographic groups most similar to Cypriots are Okinawan (10.5%, a difference of 0.16%), Immigrants from South Central Asia (10.4%, a difference of 0.49%), Assyrian/Chaldean/Syriac (10.6%, a difference of 0.74%), Immigrants from Armenia (10.6%, a difference of 0.81%), and Immigrants from Korea (10.6%, a difference of 1.3%).
| Demographics | Rating | Rank | Divorced or Separated |
| Indians (Asian) | 100.0 /100 | #6 | Exceptional 10.2% |
| Thais | 100.0 /100 | #7 | Exceptional 10.2% |
| Immigrants | Eastern Asia | 100.0 /100 | #8 | Exceptional 10.2% |
| Yup'ik | 100.0 /100 | #9 | Exceptional 10.3% |
| Immigrants | Singapore | 100.0 /100 | #10 | Exceptional 10.3% |
| Immigrants | South Central Asia | 100.0 /100 | #11 | Exceptional 10.4% |
| Okinawans | 100.0 /100 | #12 | Exceptional 10.5% |
| Cypriots | 100.0 /100 | #13 | Exceptional 10.5% |
| Assyrians/Chaldeans/Syriacs | 100.0 /100 | #14 | Exceptional 10.6% |
| Immigrants | Armenia | 100.0 /100 | #15 | Exceptional 10.6% |
| Immigrants | Korea | 100.0 /100 | #16 | Exceptional 10.6% |
| Immigrants | Israel | 100.0 /100 | #17 | Exceptional 10.6% |
| Immigrants | Iran | 100.0 /100 | #18 | Exceptional 10.6% |
| Asians | 100.0 /100 | #19 | Exceptional 10.6% |
| Burmese | 100.0 /100 | #20 | Exceptional 10.7% |
Demographics Similar to Romanians by Divorced or Separated
In terms of divorced or separated, the demographic groups most similar to Romanians are Iraqi (11.8%, a difference of 0.010%), Syrian (11.7%, a difference of 0.10%), Menominee (11.8%, a difference of 0.12%), Immigrants (11.8%, a difference of 0.13%), and Ecuadorian (11.7%, a difference of 0.14%).
| Demographics | Rating | Rank | Divorced or Separated |
| Immigrants | Norway | 95.9 /100 | #114 | Exceptional 11.7% |
| Lithuanians | 95.7 /100 | #115 | Exceptional 11.7% |
| Immigrants | Iraq | 95.4 /100 | #116 | Exceptional 11.7% |
| Immigrants | Uganda | 95.3 /100 | #117 | Exceptional 11.7% |
| Ecuadorians | 95.3 /100 | #118 | Exceptional 11.7% |
| Syrians | 95.1 /100 | #119 | Exceptional 11.7% |
| Iraqis | 94.6 /100 | #120 | Exceptional 11.8% |
| Romanians | 94.5 /100 | #121 | Exceptional 11.8% |
| Menominee | 93.8 /100 | #122 | Exceptional 11.8% |
| Immigrants | Immigrants | 93.7 /100 | #123 | Exceptional 11.8% |
| Ugandans | 93.1 /100 | #124 | Exceptional 11.8% |
| Ukrainians | 92.3 /100 | #125 | Exceptional 11.8% |
| South American Indians | 92.1 /100 | #126 | Exceptional 11.8% |
| South Africans | 88.9 /100 | #127 | Excellent 11.8% |
| Immigrants | Ecuador | 88.9 /100 | #128 | Excellent 11.8% |