Cypriot vs Immigrants from Peru Divorced or Separated
COMPARE
Cypriot
Immigrants from Peru
Divorced or Separated
Divorced or Separated Comparison
Cypriots
Immigrants from Peru
10.5%
DIVORCED OR SEPARATED
100.0/ 100
METRIC RATING
13th/ 347
METRIC RANK
12.0%
DIVORCED OR SEPARATED
57.0/ 100
METRIC RATING
169th/ 347
METRIC RANK
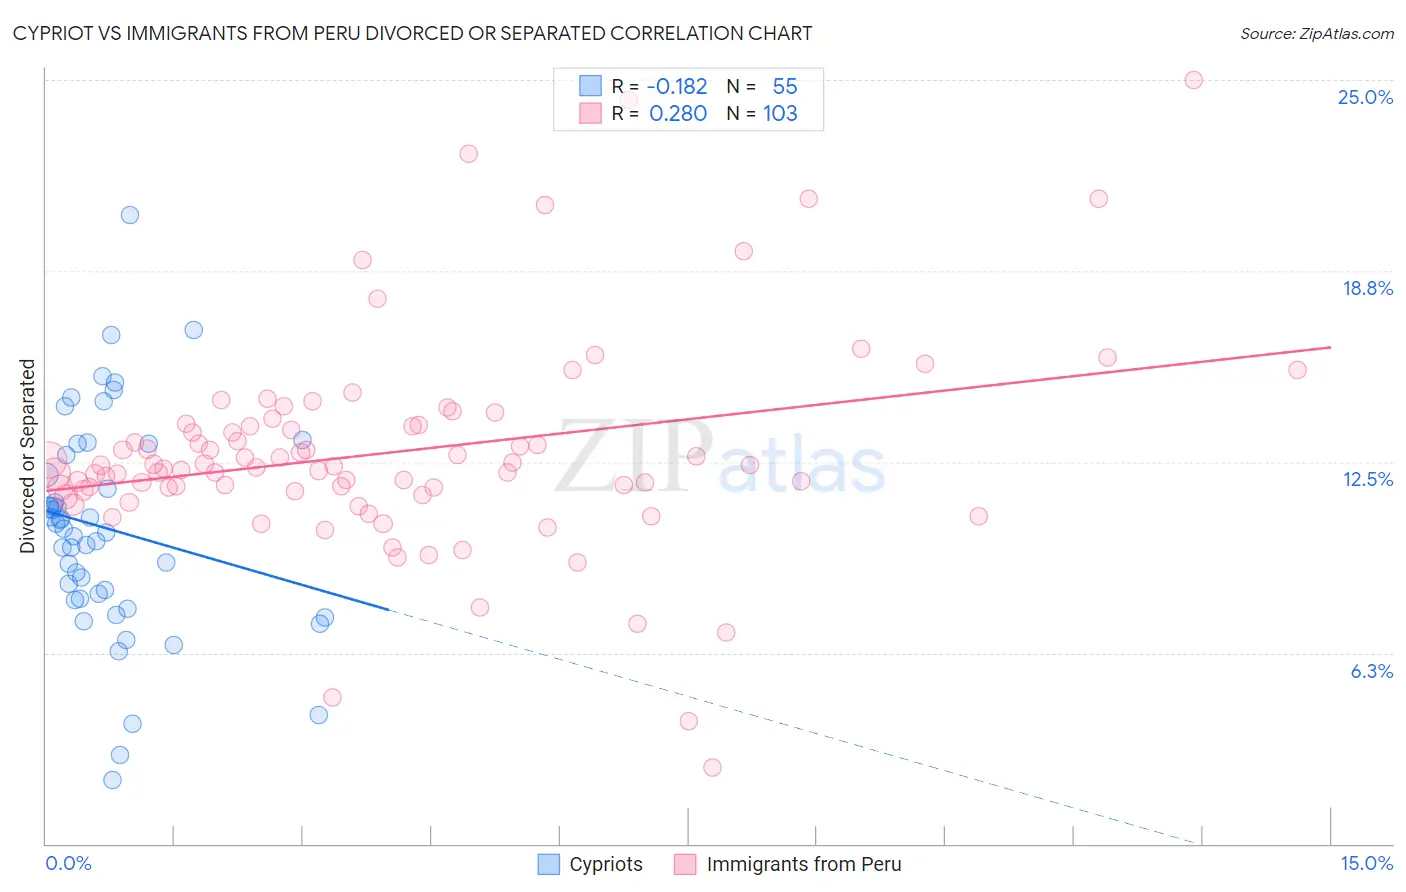
Cypriot vs Immigrants from Peru Divorced or Separated Correlation Chart
The statistical analysis conducted on geographies consisting of 61,840,758 people shows a poor negative correlation between the proportion of Cypriots and percentage of population currently divorced or separated in the United States with a correlation coefficient (R) of -0.182 and weighted average of 10.5%. Similarly, the statistical analysis conducted on geographies consisting of 328,793,574 people shows a weak positive correlation between the proportion of Immigrants from Peru and percentage of population currently divorced or separated in the United States with a correlation coefficient (R) of 0.280 and weighted average of 12.0%, a difference of 14.7%.
Divorced or Separated Correlation Summary
| Measurement | Cypriot | Immigrants from Peru |
| Minimum | 2.1% | 2.5% |
| Maximum | 20.6% | 25.0% |
| Range | 18.5% | 22.5% |
| Mean | 10.3% | 12.8% |
| Median | 10.3% | 12.4% |
| Interquartile 25% (IQ1) | 8.0% | 11.6% |
| Interquartile 75% (IQ3) | 12.7% | 13.7% |
| Interquartile Range (IQR) | 4.7% | 2.1% |
| Standard Deviation (Sample) | 3.5% | 3.5% |
| Standard Deviation (Population) | 3.5% | 3.5% |
Similar Demographics by Divorced or Separated
Demographics Similar to Cypriots by Divorced or Separated
In terms of divorced or separated, the demographic groups most similar to Cypriots are Okinawan (10.5%, a difference of 0.16%), Immigrants from South Central Asia (10.4%, a difference of 0.49%), Assyrian/Chaldean/Syriac (10.6%, a difference of 0.74%), Immigrants from Armenia (10.6%, a difference of 0.81%), and Immigrants from Korea (10.6%, a difference of 1.3%).
| Demographics | Rating | Rank | Divorced or Separated |
| Indians (Asian) | 100.0 /100 | #6 | Exceptional 10.2% |
| Thais | 100.0 /100 | #7 | Exceptional 10.2% |
| Immigrants | Eastern Asia | 100.0 /100 | #8 | Exceptional 10.2% |
| Yup'ik | 100.0 /100 | #9 | Exceptional 10.3% |
| Immigrants | Singapore | 100.0 /100 | #10 | Exceptional 10.3% |
| Immigrants | South Central Asia | 100.0 /100 | #11 | Exceptional 10.4% |
| Okinawans | 100.0 /100 | #12 | Exceptional 10.5% |
| Cypriots | 100.0 /100 | #13 | Exceptional 10.5% |
| Assyrians/Chaldeans/Syriacs | 100.0 /100 | #14 | Exceptional 10.6% |
| Immigrants | Armenia | 100.0 /100 | #15 | Exceptional 10.6% |
| Immigrants | Korea | 100.0 /100 | #16 | Exceptional 10.6% |
| Immigrants | Israel | 100.0 /100 | #17 | Exceptional 10.6% |
| Immigrants | Iran | 100.0 /100 | #18 | Exceptional 10.6% |
| Asians | 100.0 /100 | #19 | Exceptional 10.6% |
| Burmese | 100.0 /100 | #20 | Exceptional 10.7% |
Demographics Similar to Immigrants from Peru by Divorced or Separated
In terms of divorced or separated, the demographic groups most similar to Immigrants from Peru are Serbian (12.0%, a difference of 0.0%), Mexican American Indian (12.0%, a difference of 0.040%), Ethiopian (12.0%, a difference of 0.050%), Tohono O'odham (12.0%, a difference of 0.12%), and Costa Rican (12.0%, a difference of 0.13%).
| Demographics | Rating | Rank | Divorced or Separated |
| Samoans | 64.3 /100 | #162 | Good 12.0% |
| Navajo | 63.9 /100 | #163 | Good 12.0% |
| Swiss | 63.6 /100 | #164 | Good 12.0% |
| German Russians | 61.8 /100 | #165 | Good 12.0% |
| Tohono O'odham | 60.4 /100 | #166 | Good 12.0% |
| Ethiopians | 58.5 /100 | #167 | Average 12.0% |
| Serbians | 57.1 /100 | #168 | Average 12.0% |
| Immigrants | Peru | 57.0 /100 | #169 | Average 12.0% |
| Mexican American Indians | 55.8 /100 | #170 | Average 12.0% |
| Costa Ricans | 53.3 /100 | #171 | Average 12.0% |
| Immigrants | Mexico | 53.2 /100 | #172 | Average 12.0% |
| Immigrants | Moldova | 50.4 /100 | #173 | Average 12.1% |
| Hawaiians | 50.0 /100 | #174 | Average 12.1% |
| Immigrants | Sierra Leone | 50.0 /100 | #175 | Average 12.1% |
| Pennsylvania Germans | 48.9 /100 | #176 | Average 12.1% |