Cuban vs Immigrants from Latvia Child Poverty Under the Age of 5
COMPARE
Cuban
Immigrants from Latvia
Child Poverty Under the Age of 5
Child Poverty Under the Age of 5 Comparison
Cubans
Immigrants from Latvia
19.1%
CHILD POVERTY UNDER THE AGE OF 5
1.7/ 100
METRIC RATING
223rd/ 347
METRIC RANK
15.6%
CHILD POVERTY UNDER THE AGE OF 5
97.4/ 100
METRIC RATING
85th/ 347
METRIC RANK
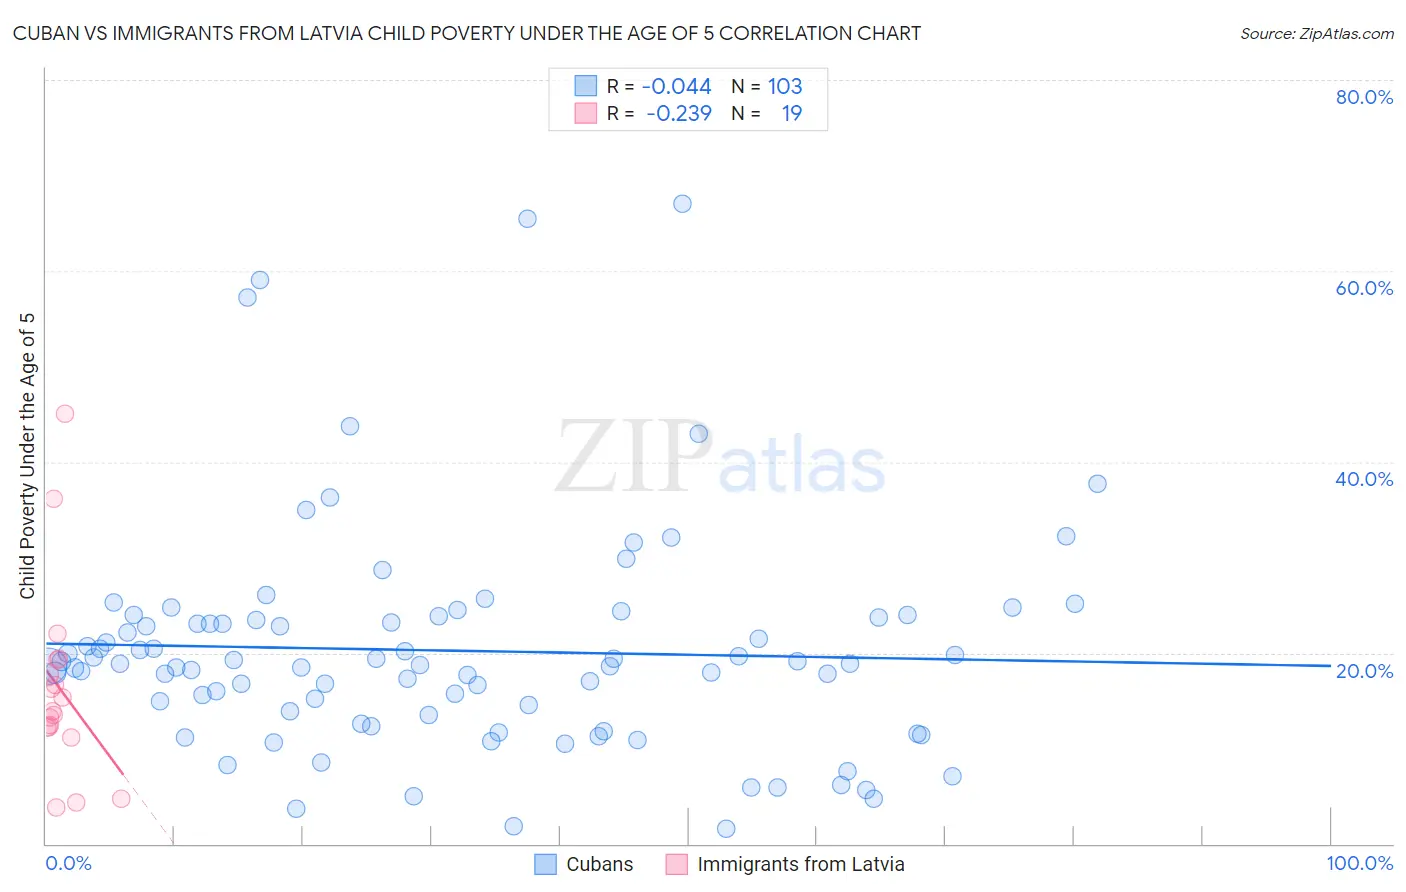
Cuban vs Immigrants from Latvia Child Poverty Under the Age of 5 Correlation Chart
The statistical analysis conducted on geographies consisting of 429,948,450 people shows no correlation between the proportion of Cubans and poverty level among children under the age of 5 in the United States with a correlation coefficient (R) of -0.044 and weighted average of 19.1%. Similarly, the statistical analysis conducted on geographies consisting of 111,248,278 people shows a weak negative correlation between the proportion of Immigrants from Latvia and poverty level among children under the age of 5 in the United States with a correlation coefficient (R) of -0.239 and weighted average of 15.6%, a difference of 22.1%.
Child Poverty Under the Age of 5 Correlation Summary
| Measurement | Cuban | Immigrants from Latvia |
| Minimum | 1.6% | 3.8% |
| Maximum | 67.1% | 45.0% |
| Range | 65.5% | 41.2% |
| Mean | 20.2% | 16.3% |
| Median | 18.8% | 13.8% |
| Interquartile 25% (IQ1) | 13.5% | 12.2% |
| Interquartile 75% (IQ3) | 23.6% | 19.3% |
| Interquartile Range (IQR) | 10.1% | 7.1% |
| Standard Deviation (Sample) | 11.7% | 10.0% |
| Standard Deviation (Population) | 11.7% | 9.7% |
Similar Demographics by Child Poverty Under the Age of 5
Demographics Similar to Cubans by Child Poverty Under the Age of 5
In terms of child poverty under the age of 5, the demographic groups most similar to Cubans are Alsatian (19.1%, a difference of 0.020%), Nicaraguan (19.1%, a difference of 0.11%), Nigerian (19.1%, a difference of 0.14%), Immigrants from Eritrea (19.1%, a difference of 0.16%), and Cape Verdean (19.1%, a difference of 0.34%).
| Demographics | Rating | Rank | Child Poverty Under the Age of 5 |
| Hmong | 5.0 /100 | #216 | Tragic 18.5% |
| Immigrants | Africa | 4.6 /100 | #217 | Tragic 18.6% |
| Delaware | 3.4 /100 | #218 | Tragic 18.7% |
| German Russians | 3.0 /100 | #219 | Tragic 18.8% |
| Immigrants | Azores | 2.6 /100 | #220 | Tragic 18.9% |
| Immigrants | Nigeria | 2.1 /100 | #221 | Tragic 19.0% |
| Alsatians | 1.7 /100 | #222 | Tragic 19.1% |
| Cubans | 1.7 /100 | #223 | Tragic 19.1% |
| Nicaraguans | 1.6 /100 | #224 | Tragic 19.1% |
| Nigerians | 1.6 /100 | #225 | Tragic 19.1% |
| Immigrants | Eritrea | 1.5 /100 | #226 | Tragic 19.1% |
| Cape Verdeans | 1.4 /100 | #227 | Tragic 19.1% |
| Immigrants | Sudan | 1.3 /100 | #228 | Tragic 19.2% |
| Ghanaians | 1.2 /100 | #229 | Tragic 19.2% |
| Ecuadorians | 1.2 /100 | #230 | Tragic 19.2% |
Demographics Similar to Immigrants from Latvia by Child Poverty Under the Age of 5
In terms of child poverty under the age of 5, the demographic groups most similar to Immigrants from Latvia are Immigrants from Malaysia (15.6%, a difference of 0.0%), Immigrants from Vietnam (15.6%, a difference of 0.080%), Jordanian (15.6%, a difference of 0.14%), Immigrants from Netherlands (15.6%, a difference of 0.16%), and Chilean (15.6%, a difference of 0.18%).
| Demographics | Rating | Rank | Child Poverty Under the Age of 5 |
| Sri Lankans | 98.1 /100 | #78 | Exceptional 15.5% |
| Australians | 98.0 /100 | #79 | Exceptional 15.5% |
| Italians | 97.9 /100 | #80 | Exceptional 15.5% |
| Czechs | 97.8 /100 | #81 | Exceptional 15.5% |
| Immigrants | Italy | 97.7 /100 | #82 | Exceptional 15.6% |
| Chileans | 97.6 /100 | #83 | Exceptional 15.6% |
| Immigrants | Netherlands | 97.6 /100 | #84 | Exceptional 15.6% |
| Immigrants | Latvia | 97.4 /100 | #85 | Exceptional 15.6% |
| Immigrants | Malaysia | 97.4 /100 | #86 | Exceptional 15.6% |
| Immigrants | Vietnam | 97.4 /100 | #87 | Exceptional 15.6% |
| Jordanians | 97.3 /100 | #88 | Exceptional 15.6% |
| Immigrants | Croatia | 97.3 /100 | #89 | Exceptional 15.6% |
| Immigrants | France | 97.3 /100 | #90 | Exceptional 15.6% |
| Poles | 97.2 /100 | #91 | Exceptional 15.7% |
| Scandinavians | 97.1 /100 | #92 | Exceptional 15.7% |