Cuban vs Immigrants from Latvia Female Unemployment
COMPARE
Cuban
Immigrants from Latvia
Female Unemployment
Female Unemployment Comparison
Cubans
Immigrants from Latvia
4.9%
FEMALE UNEMPLOYMENT
98.3/ 100
METRIC RATING
67th/ 347
METRIC RANK
5.1%
FEMALE UNEMPLOYMENT
84.6/ 100
METRIC RATING
135th/ 347
METRIC RANK
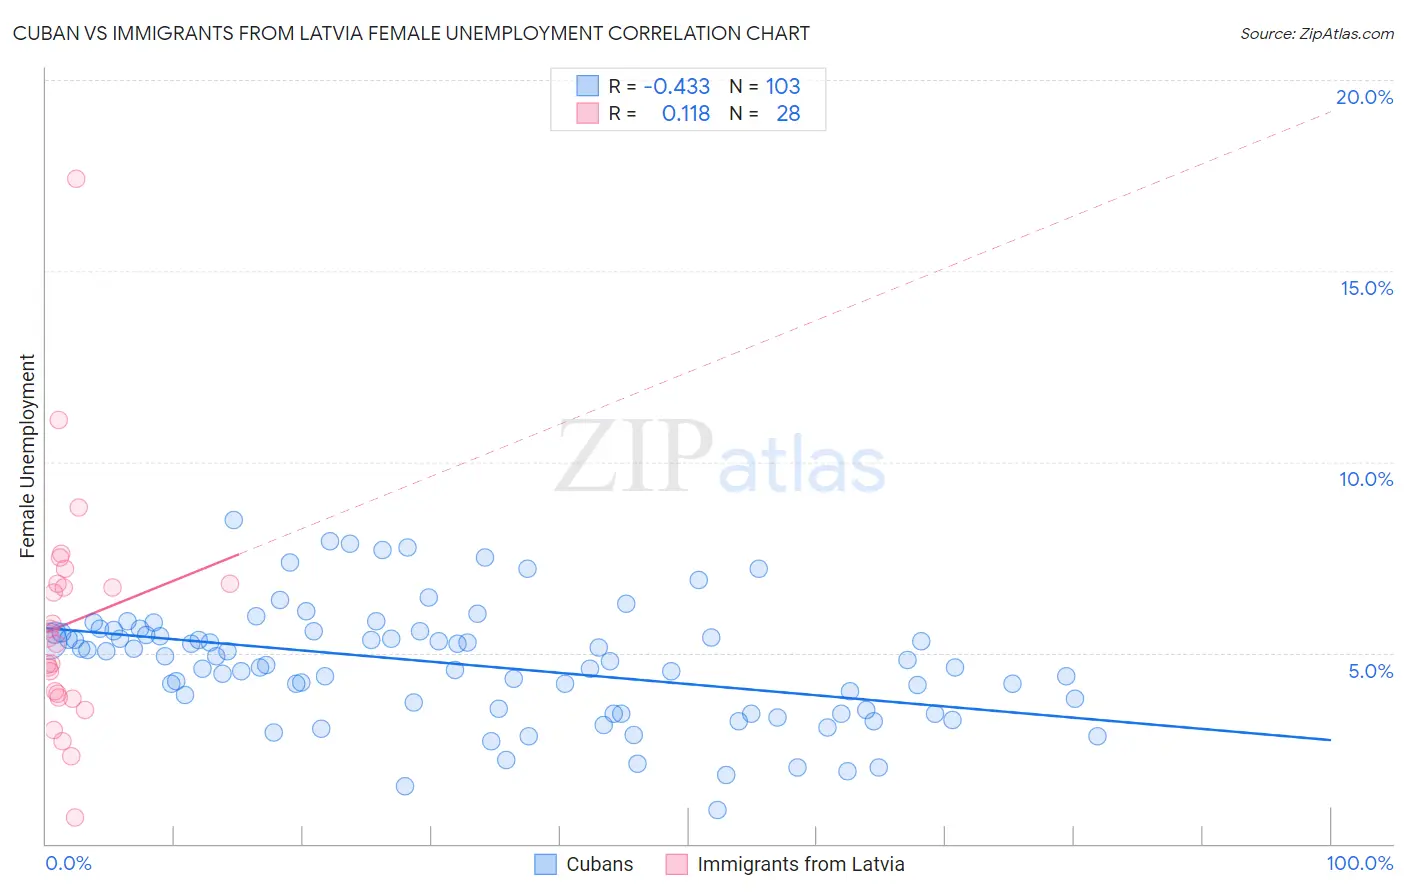
Cuban vs Immigrants from Latvia Female Unemployment Correlation Chart
The statistical analysis conducted on geographies consisting of 446,472,096 people shows a moderate negative correlation between the proportion of Cubans and unemploymnet rate among females in the United States with a correlation coefficient (R) of -0.433 and weighted average of 4.9%. Similarly, the statistical analysis conducted on geographies consisting of 113,613,116 people shows a poor positive correlation between the proportion of Immigrants from Latvia and unemploymnet rate among females in the United States with a correlation coefficient (R) of 0.118 and weighted average of 5.1%, a difference of 3.7%.
Female Unemployment Correlation Summary
| Measurement | Cuban | Immigrants from Latvia |
| Minimum | 0.90% | 0.70% |
| Maximum | 8.5% | 17.4% |
| Range | 7.6% | 16.7% |
| Mean | 4.7% | 5.8% |
| Median | 4.8% | 5.3% |
| Interquartile 25% (IQ1) | 3.5% | 3.9% |
| Interquartile 75% (IQ3) | 5.5% | 6.8% |
| Interquartile Range (IQR) | 2.0% | 2.9% |
| Standard Deviation (Sample) | 1.5% | 3.1% |
| Standard Deviation (Population) | 1.5% | 3.1% |
Similar Demographics by Female Unemployment
Demographics Similar to Cubans by Female Unemployment
In terms of female unemployment, the demographic groups most similar to Cubans are Hungarian (4.9%, a difference of 0.0%), Tlingit-Haida (4.9%, a difference of 0.010%), Immigrants from Ireland (4.9%, a difference of 0.020%), Immigrants from North America (4.9%, a difference of 0.030%), and Osage (4.9%, a difference of 0.060%).
| Demographics | Rating | Rank | Female Unemployment |
| Immigrants | Scotland | 98.6 /100 | #60 | Exceptional 4.9% |
| Immigrants | Canada | 98.6 /100 | #61 | Exceptional 4.9% |
| Immigrants | Nepal | 98.6 /100 | #62 | Exceptional 4.9% |
| Immigrants | Belgium | 98.5 /100 | #63 | Exceptional 4.9% |
| Celtics | 98.5 /100 | #64 | Exceptional 4.9% |
| Immigrants | North America | 98.3 /100 | #65 | Exceptional 4.9% |
| Hungarians | 98.3 /100 | #66 | Exceptional 4.9% |
| Cubans | 98.3 /100 | #67 | Exceptional 4.9% |
| Tlingit-Haida | 98.3 /100 | #68 | Exceptional 4.9% |
| Immigrants | Ireland | 98.2 /100 | #69 | Exceptional 4.9% |
| Osage | 98.2 /100 | #70 | Exceptional 4.9% |
| German Russians | 98.1 /100 | #71 | Exceptional 4.9% |
| Immigrants | Northern Europe | 98.0 /100 | #72 | Exceptional 4.9% |
| Russians | 98.0 /100 | #73 | Exceptional 5.0% |
| Immigrants | Bolivia | 98.0 /100 | #74 | Exceptional 5.0% |
Demographics Similar to Immigrants from Latvia by Female Unemployment
In terms of female unemployment, the demographic groups most similar to Immigrants from Latvia are Immigrants from Eritrea (5.1%, a difference of 0.0%), Immigrants from Hong Kong (5.1%, a difference of 0.030%), Immigrants from Sri Lanka (5.1%, a difference of 0.050%), Indian (Asian) (5.1%, a difference of 0.050%), and Pakistani (5.1%, a difference of 0.090%).
| Demographics | Rating | Rank | Female Unemployment |
| Chileans | 85.8 /100 | #128 | Excellent 5.1% |
| Ethiopians | 85.7 /100 | #129 | Excellent 5.1% |
| Maltese | 85.5 /100 | #130 | Excellent 5.1% |
| Immigrants | Ethiopia | 85.4 /100 | #131 | Excellent 5.1% |
| Immigrants | Sri Lanka | 85.0 /100 | #132 | Excellent 5.1% |
| Immigrants | Hong Kong | 84.8 /100 | #133 | Excellent 5.1% |
| Immigrants | Eritrea | 84.6 /100 | #134 | Excellent 5.1% |
| Immigrants | Latvia | 84.6 /100 | #135 | Excellent 5.1% |
| Indians (Asian) | 84.2 /100 | #136 | Excellent 5.1% |
| Pakistanis | 83.8 /100 | #137 | Excellent 5.1% |
| Chickasaw | 83.2 /100 | #138 | Excellent 5.1% |
| Immigrants | Eastern Asia | 83.0 /100 | #139 | Excellent 5.1% |
| Immigrants | France | 82.7 /100 | #140 | Excellent 5.1% |
| Immigrants | Eastern Europe | 81.5 /100 | #141 | Excellent 5.1% |
| Palestinians | 80.8 /100 | #142 | Excellent 5.1% |