Immigrants from Bulgaria vs Swiss Currently Married
COMPARE
Immigrants from Bulgaria
Swiss
Currently Married
Currently Married Comparison
Immigrants from Bulgaria
Swiss
47.9%
CURRENTLY MARRIED
94.8/ 100
METRIC RATING
95th/ 347
METRIC RANK
49.7%
CURRENTLY MARRIED
99.9/ 100
METRIC RATING
12th/ 347
METRIC RANK
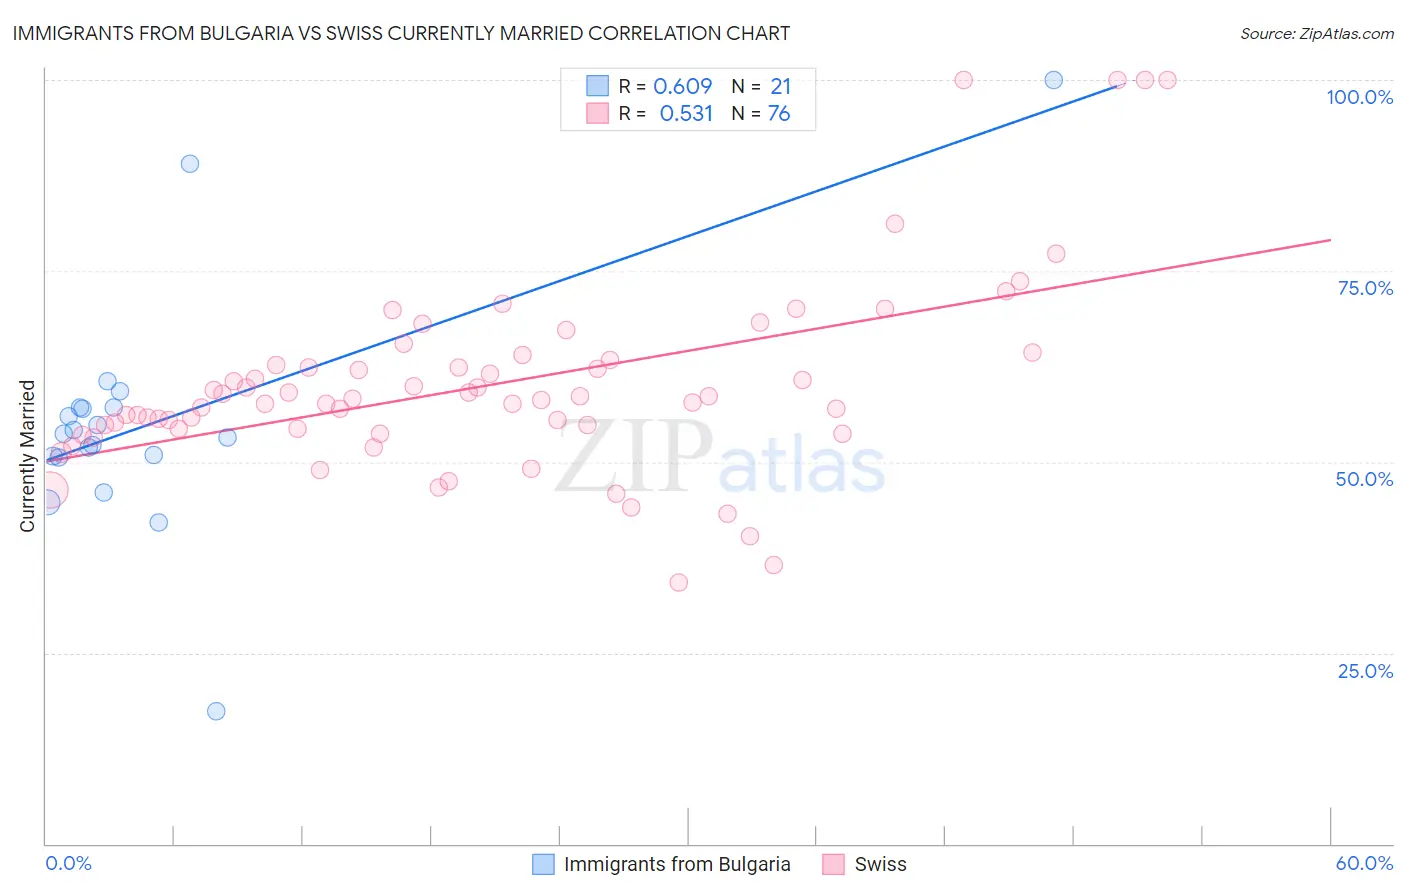
Immigrants from Bulgaria vs Swiss Currently Married Correlation Chart
The statistical analysis conducted on geographies consisting of 172,548,361 people shows a significant positive correlation between the proportion of Immigrants from Bulgaria and percentage of population currently married in the United States with a correlation coefficient (R) of 0.609 and weighted average of 47.9%. Similarly, the statistical analysis conducted on geographies consisting of 464,962,808 people shows a substantial positive correlation between the proportion of Swiss and percentage of population currently married in the United States with a correlation coefficient (R) of 0.531 and weighted average of 49.7%, a difference of 3.9%.
Currently Married Correlation Summary
| Measurement | Immigrants from Bulgaria | Swiss |
| Minimum | 17.4% | 34.3% |
| Maximum | 100.0% | 100.0% |
| Range | 82.6% | 65.7% |
| Mean | 55.2% | 60.1% |
| Median | 53.7% | 58.2% |
| Interquartile 25% (IQ1) | 50.7% | 54.3% |
| Interquartile 75% (IQ3) | 57.1% | 63.1% |
| Interquartile Range (IQR) | 6.4% | 8.8% |
| Standard Deviation (Sample) | 16.0% | 12.7% |
| Standard Deviation (Population) | 15.6% | 12.6% |
Similar Demographics by Currently Married
Demographics Similar to Immigrants from Bulgaria by Currently Married
In terms of currently married, the demographic groups most similar to Immigrants from Bulgaria are Egyptian (47.9%, a difference of 0.0%), Immigrants from Ukraine (47.9%, a difference of 0.010%), Immigrants from China (47.9%, a difference of 0.020%), Native Hawaiian (47.9%, a difference of 0.040%), and Lebanese (47.9%, a difference of 0.050%).
| Demographics | Rating | Rank | Currently Married |
| Immigrants | Eastern Europe | 96.1 /100 | #88 | Exceptional 48.0% |
| Indians (Asian) | 95.8 /100 | #89 | Exceptional 48.0% |
| Americans | 95.7 /100 | #90 | Exceptional 48.0% |
| Immigrants | Bolivia | 95.6 /100 | #91 | Exceptional 47.9% |
| Koreans | 95.4 /100 | #92 | Exceptional 47.9% |
| Lebanese | 95.1 /100 | #93 | Exceptional 47.9% |
| Native Hawaiians | 95.0 /100 | #94 | Exceptional 47.9% |
| Immigrants | Bulgaria | 94.8 /100 | #95 | Exceptional 47.9% |
| Egyptians | 94.8 /100 | #96 | Exceptional 47.9% |
| Immigrants | Ukraine | 94.8 /100 | #97 | Exceptional 47.9% |
| Immigrants | China | 94.7 /100 | #98 | Exceptional 47.9% |
| Immigrants | Sweden | 94.3 /100 | #99 | Exceptional 47.8% |
| Celtics | 94.2 /100 | #100 | Exceptional 47.8% |
| Immigrants | Germany | 94.1 /100 | #101 | Exceptional 47.8% |
| Turks | 93.9 /100 | #102 | Exceptional 47.8% |
Demographics Similar to Swiss by Currently Married
In terms of currently married, the demographic groups most similar to Swiss are English (49.7%, a difference of 0.0%), Filipino (49.7%, a difference of 0.020%), Dutch (49.6%, a difference of 0.26%), Czech (49.9%, a difference of 0.27%), and German (49.6%, a difference of 0.28%).
| Demographics | Rating | Rank | Currently Married |
| Danes | 100.0 /100 | #5 | Exceptional 50.5% |
| Norwegians | 100.0 /100 | #6 | Exceptional 50.2% |
| Immigrants | South Central Asia | 100.0 /100 | #7 | Exceptional 50.0% |
| Swedes | 100.0 /100 | #8 | Exceptional 50.0% |
| Czechs | 99.9 /100 | #9 | Exceptional 49.9% |
| Filipinos | 99.9 /100 | #10 | Exceptional 49.7% |
| English | 99.9 /100 | #11 | Exceptional 49.7% |
| Swiss | 99.9 /100 | #12 | Exceptional 49.7% |
| Dutch | 99.9 /100 | #13 | Exceptional 49.6% |
| Germans | 99.9 /100 | #14 | Exceptional 49.6% |
| Pennsylvania Germans | 99.9 /100 | #15 | Exceptional 49.6% |
| Chinese | 99.9 /100 | #16 | Exceptional 49.5% |
| Scandinavians | 99.9 /100 | #17 | Exceptional 49.5% |
| Immigrants | Scotland | 99.8 /100 | #18 | Exceptional 49.3% |
| Europeans | 99.8 /100 | #19 | Exceptional 49.3% |