Puerto Rican vs Immigrants from Zimbabwe Single Father Households
COMPARE
Puerto Rican
Immigrants from Zimbabwe
Single Father Households
Single Father Households Comparison
Puerto Ricans
Immigrants from Zimbabwe
2.6%
SINGLE FATHER HOUSEHOLDS
0.2/ 100
METRIC RATING
274th/ 347
METRIC RANK
2.2%
SINGLE FATHER HOUSEHOLDS
90.2/ 100
METRIC RATING
145th/ 347
METRIC RANK
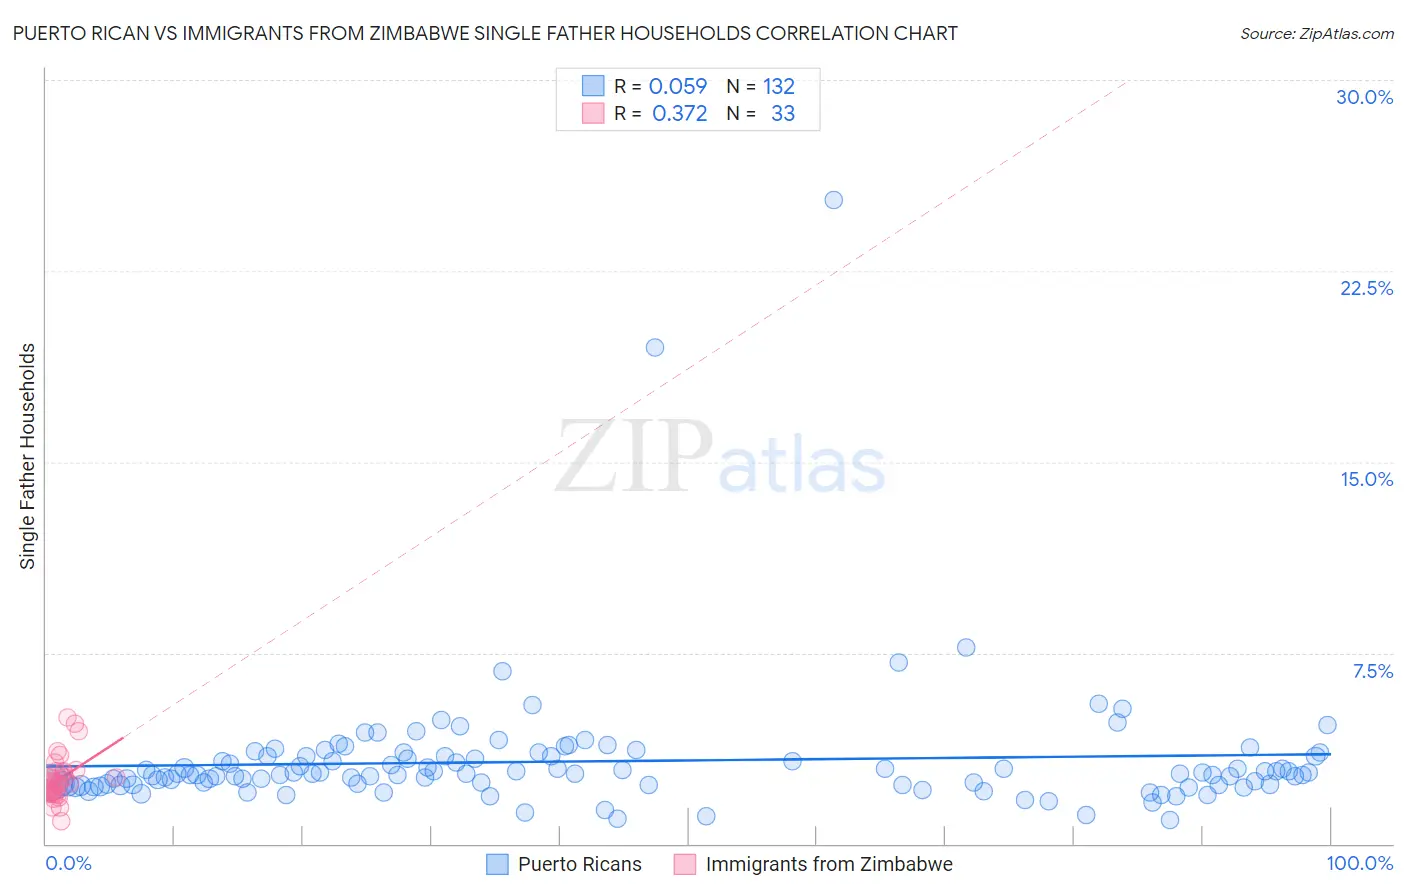
Puerto Rican vs Immigrants from Zimbabwe Single Father Households Correlation Chart
The statistical analysis conducted on geographies consisting of 519,503,962 people shows a slight positive correlation between the proportion of Puerto Ricans and percentage of single father households in the United States with a correlation coefficient (R) of 0.059 and weighted average of 2.6%. Similarly, the statistical analysis conducted on geographies consisting of 117,591,458 people shows a mild positive correlation between the proportion of Immigrants from Zimbabwe and percentage of single father households in the United States with a correlation coefficient (R) of 0.372 and weighted average of 2.2%, a difference of 16.1%.
Single Father Households Correlation Summary
| Measurement | Puerto Rican | Immigrants from Zimbabwe |
| Minimum | 0.92% | 0.87% |
| Maximum | 25.3% | 5.0% |
| Range | 24.4% | 4.1% |
| Mean | 3.2% | 2.5% |
| Median | 2.7% | 2.4% |
| Interquartile 25% (IQ1) | 2.3% | 2.0% |
| Interquartile 75% (IQ3) | 3.5% | 2.9% |
| Interquartile Range (IQR) | 1.1% | 0.89% |
| Standard Deviation (Sample) | 2.6% | 0.90% |
| Standard Deviation (Population) | 2.6% | 0.89% |
Similar Demographics by Single Father Households
Demographics Similar to Puerto Ricans by Single Father Households
In terms of single father households, the demographic groups most similar to Puerto Ricans are Iroquois (2.6%, a difference of 0.030%), Creek (2.6%, a difference of 0.070%), Belizean (2.6%, a difference of 0.070%), Immigrants from Dominican Republic (2.6%, a difference of 0.42%), and Seminole (2.6%, a difference of 0.44%).
| Demographics | Rating | Rank | Single Father Households |
| Guamanians/Chamorros | 0.4 /100 | #267 | Tragic 2.6% |
| Haitians | 0.4 /100 | #268 | Tragic 2.6% |
| Cubans | 0.3 /100 | #269 | Tragic 2.6% |
| Seminole | 0.3 /100 | #270 | Tragic 2.6% |
| Creek | 0.2 /100 | #271 | Tragic 2.6% |
| Belizeans | 0.2 /100 | #272 | Tragic 2.6% |
| Iroquois | 0.2 /100 | #273 | Tragic 2.6% |
| Puerto Ricans | 0.2 /100 | #274 | Tragic 2.6% |
| Immigrants | Dominican Republic | 0.2 /100 | #275 | Tragic 2.6% |
| Immigrants | Haiti | 0.1 /100 | #276 | Tragic 2.6% |
| Shoshone | 0.1 /100 | #277 | Tragic 2.6% |
| Cherokee | 0.1 /100 | #278 | Tragic 2.6% |
| Samoans | 0.1 /100 | #279 | Tragic 2.6% |
| Immigrants | Portugal | 0.1 /100 | #280 | Tragic 2.6% |
| Nicaraguans | 0.1 /100 | #281 | Tragic 2.6% |
Demographics Similar to Immigrants from Zimbabwe by Single Father Households
In terms of single father households, the demographic groups most similar to Immigrants from Zimbabwe are Northern European (2.2%, a difference of 0.080%), Slovak (2.2%, a difference of 0.11%), Slavic (2.2%, a difference of 0.26%), South American Indian (2.3%, a difference of 0.35%), and Senegalese (2.3%, a difference of 0.36%).
| Demographics | Rating | Rank | Single Father Households |
| West Indians | 94.1 /100 | #138 | Exceptional 2.2% |
| Brazilians | 92.8 /100 | #139 | Exceptional 2.2% |
| British | 92.8 /100 | #140 | Exceptional 2.2% |
| Laotians | 92.5 /100 | #141 | Exceptional 2.2% |
| Luxembourgers | 92.3 /100 | #142 | Exceptional 2.2% |
| Immigrants | Nepal | 92.1 /100 | #143 | Exceptional 2.2% |
| Slovaks | 90.7 /100 | #144 | Exceptional 2.2% |
| Immigrants | Zimbabwe | 90.2 /100 | #145 | Exceptional 2.2% |
| Northern Europeans | 89.8 /100 | #146 | Excellent 2.2% |
| Slavs | 88.9 /100 | #147 | Excellent 2.2% |
| South American Indians | 88.5 /100 | #148 | Excellent 2.3% |
| Senegalese | 88.4 /100 | #149 | Excellent 2.3% |
| Venezuelans | 86.2 /100 | #150 | Excellent 2.3% |
| Immigrants | Syria | 84.8 /100 | #151 | Excellent 2.3% |
| Immigrants | Venezuela | 83.2 /100 | #152 | Excellent 2.3% |