Russian vs Immigrants from Zimbabwe Single Father Households
COMPARE
Russian
Immigrants from Zimbabwe
Single Father Households
Single Father Households Comparison
Russians
Immigrants from Zimbabwe
2.0%
SINGLE FATHER HOUSEHOLDS
100.0/ 100
METRIC RATING
45th/ 347
METRIC RANK
2.2%
SINGLE FATHER HOUSEHOLDS
90.2/ 100
METRIC RATING
145th/ 347
METRIC RANK
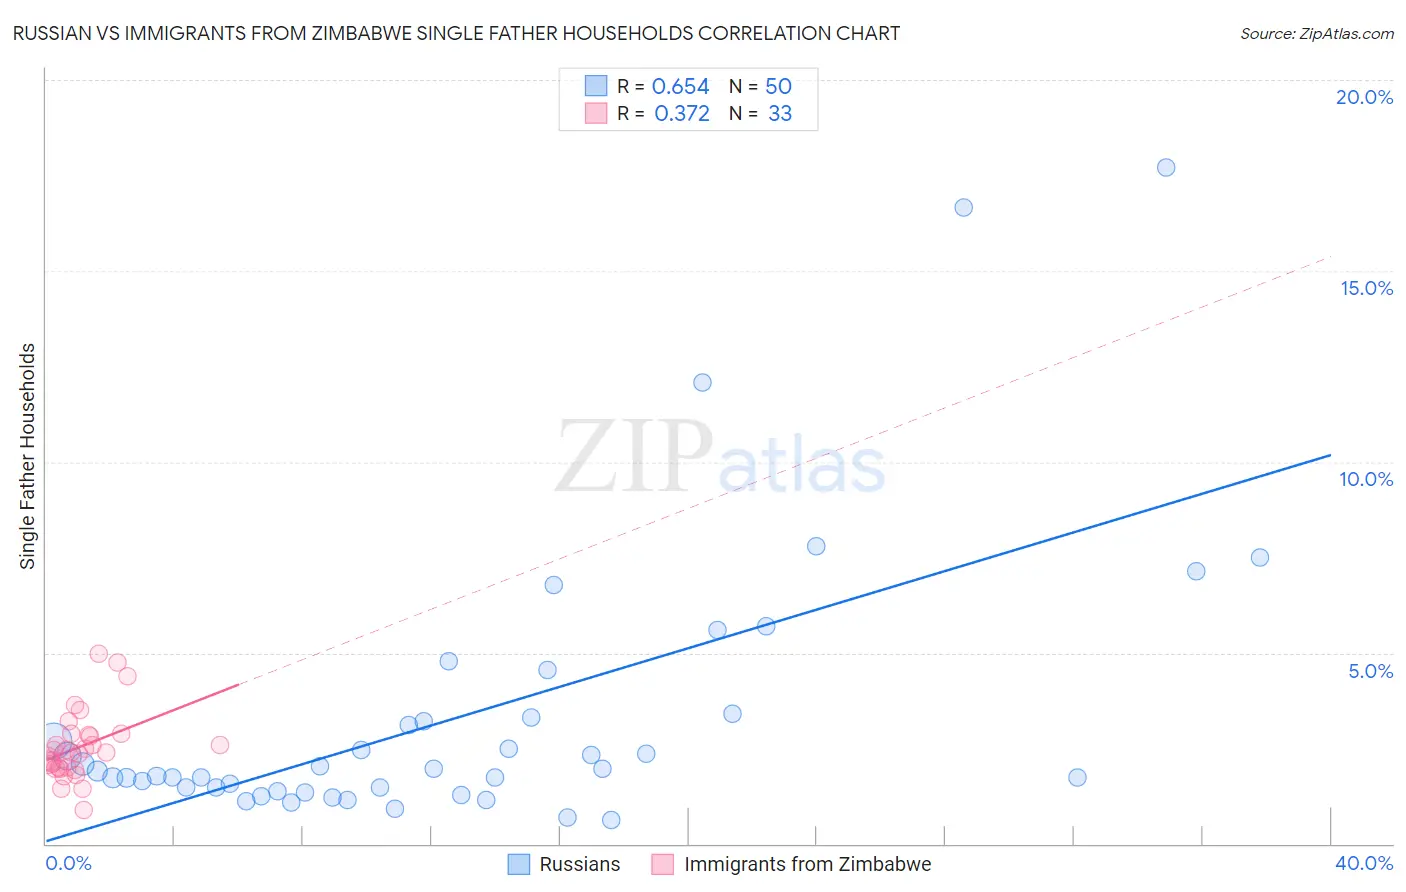
Russian vs Immigrants from Zimbabwe Single Father Households Correlation Chart
The statistical analysis conducted on geographies consisting of 503,310,659 people shows a significant positive correlation between the proportion of Russians and percentage of single father households in the United States with a correlation coefficient (R) of 0.654 and weighted average of 2.0%. Similarly, the statistical analysis conducted on geographies consisting of 117,591,458 people shows a mild positive correlation between the proportion of Immigrants from Zimbabwe and percentage of single father households in the United States with a correlation coefficient (R) of 0.372 and weighted average of 2.2%, a difference of 11.8%.
Single Father Households Correlation Summary
| Measurement | Russian | Immigrants from Zimbabwe |
| Minimum | 0.62% | 0.87% |
| Maximum | 17.7% | 5.0% |
| Range | 17.1% | 4.1% |
| Mean | 3.3% | 2.5% |
| Median | 1.9% | 2.4% |
| Interquartile 25% (IQ1) | 1.5% | 2.0% |
| Interquartile 75% (IQ3) | 3.3% | 2.9% |
| Interquartile Range (IQR) | 1.8% | 0.89% |
| Standard Deviation (Sample) | 3.6% | 0.90% |
| Standard Deviation (Population) | 3.6% | 0.89% |
Similar Demographics by Single Father Households
Demographics Similar to Russians by Single Father Households
In terms of single father households, the demographic groups most similar to Russians are Latvian (2.0%, a difference of 0.020%), Immigrants from Grenada (2.0%, a difference of 0.10%), Immigrants from Lebanon (2.0%, a difference of 0.10%), Macedonian (2.0%, a difference of 0.33%), and Immigrants from Ukraine (2.0%, a difference of 0.46%).
| Demographics | Rating | Rank | Single Father Households |
| Immigrants | Eastern Europe | 100.0 /100 | #38 | Exceptional 2.0% |
| Immigrants | Sri Lanka | 100.0 /100 | #39 | Exceptional 2.0% |
| Immigrants | Bulgaria | 100.0 /100 | #40 | Exceptional 2.0% |
| Immigrants | Turkey | 100.0 /100 | #41 | Exceptional 2.0% |
| Macedonians | 100.0 /100 | #42 | Exceptional 2.0% |
| Immigrants | Grenada | 100.0 /100 | #43 | Exceptional 2.0% |
| Latvians | 100.0 /100 | #44 | Exceptional 2.0% |
| Russians | 100.0 /100 | #45 | Exceptional 2.0% |
| Immigrants | Lebanon | 100.0 /100 | #46 | Exceptional 2.0% |
| Immigrants | Ukraine | 99.9 /100 | #47 | Exceptional 2.0% |
| Immigrants | Kazakhstan | 99.9 /100 | #48 | Exceptional 2.0% |
| Immigrants | Serbia | 99.9 /100 | #49 | Exceptional 2.0% |
| Immigrants | Switzerland | 99.9 /100 | #50 | Exceptional 2.0% |
| Immigrants | Poland | 99.9 /100 | #51 | Exceptional 2.0% |
| Immigrants | Europe | 99.9 /100 | #52 | Exceptional 2.0% |
Demographics Similar to Immigrants from Zimbabwe by Single Father Households
In terms of single father households, the demographic groups most similar to Immigrants from Zimbabwe are Northern European (2.2%, a difference of 0.080%), Slovak (2.2%, a difference of 0.11%), Slavic (2.2%, a difference of 0.26%), South American Indian (2.3%, a difference of 0.35%), and Senegalese (2.3%, a difference of 0.36%).
| Demographics | Rating | Rank | Single Father Households |
| West Indians | 94.1 /100 | #138 | Exceptional 2.2% |
| Brazilians | 92.8 /100 | #139 | Exceptional 2.2% |
| British | 92.8 /100 | #140 | Exceptional 2.2% |
| Laotians | 92.5 /100 | #141 | Exceptional 2.2% |
| Luxembourgers | 92.3 /100 | #142 | Exceptional 2.2% |
| Immigrants | Nepal | 92.1 /100 | #143 | Exceptional 2.2% |
| Slovaks | 90.7 /100 | #144 | Exceptional 2.2% |
| Immigrants | Zimbabwe | 90.2 /100 | #145 | Exceptional 2.2% |
| Northern Europeans | 89.8 /100 | #146 | Excellent 2.2% |
| Slavs | 88.9 /100 | #147 | Excellent 2.2% |
| South American Indians | 88.5 /100 | #148 | Excellent 2.3% |
| Senegalese | 88.4 /100 | #149 | Excellent 2.3% |
| Venezuelans | 86.2 /100 | #150 | Excellent 2.3% |
| Immigrants | Syria | 84.8 /100 | #151 | Excellent 2.3% |
| Immigrants | Venezuela | 83.2 /100 | #152 | Excellent 2.3% |