Basque vs Immigrants from Liberia Single Father Households
COMPARE
Basque
Immigrants from Liberia
Single Father Households
Single Father Households Comparison
Basques
Immigrants from Liberia
2.5%
SINGLE FATHER HOUSEHOLDS
2.5/ 100
METRIC RATING
245th/ 347
METRIC RANK
2.5%
SINGLE FATHER HOUSEHOLDS
0.8/ 100
METRIC RATING
262nd/ 347
METRIC RANK
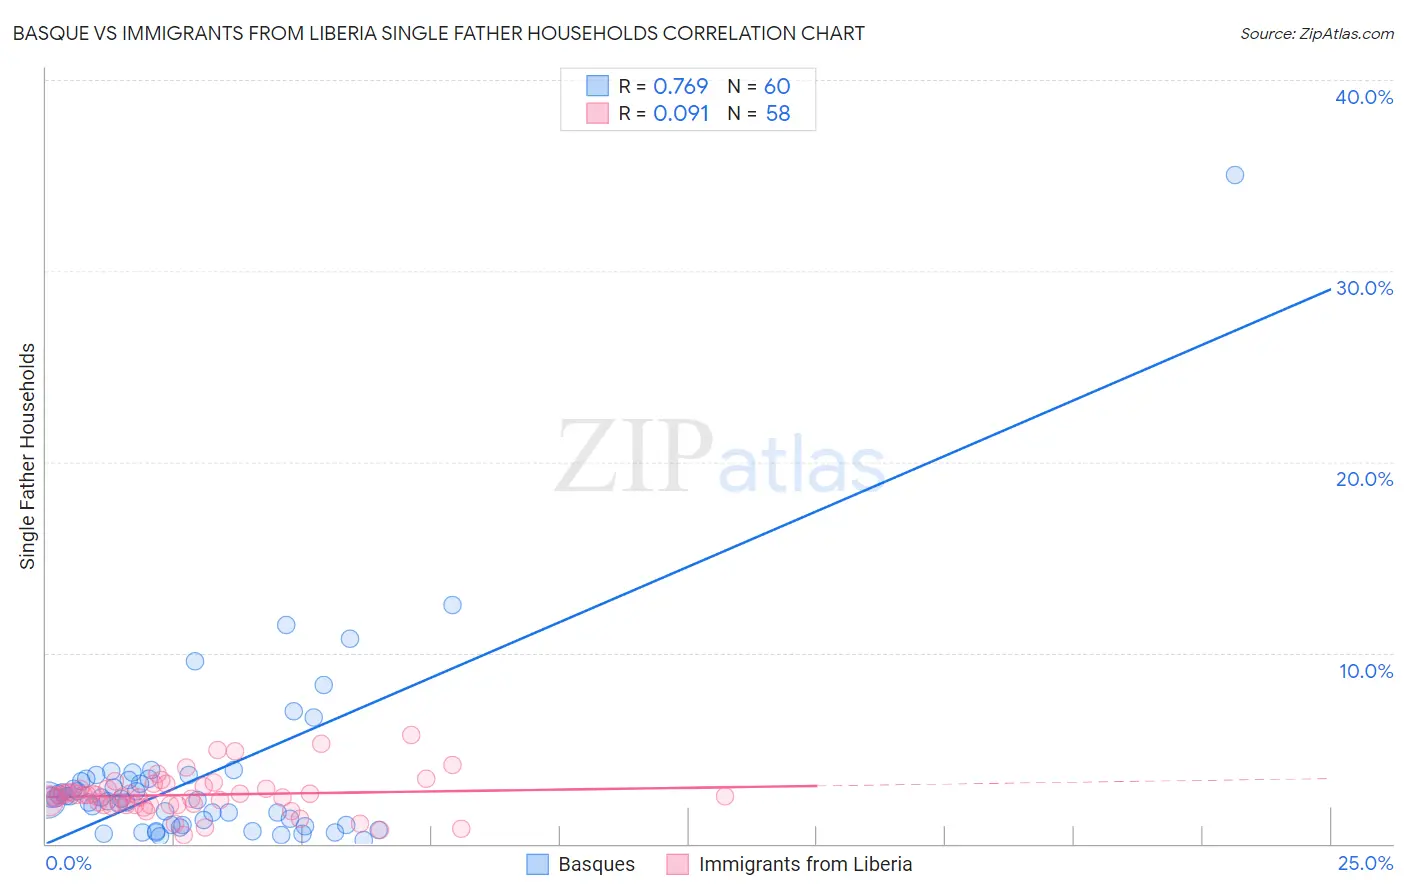
Basque vs Immigrants from Liberia Single Father Households Correlation Chart
The statistical analysis conducted on geographies consisting of 165,235,183 people shows a strong positive correlation between the proportion of Basques and percentage of single father households in the United States with a correlation coefficient (R) of 0.769 and weighted average of 2.5%. Similarly, the statistical analysis conducted on geographies consisting of 135,021,934 people shows a slight positive correlation between the proportion of Immigrants from Liberia and percentage of single father households in the United States with a correlation coefficient (R) of 0.091 and weighted average of 2.5%, a difference of 2.0%.
Single Father Households Correlation Summary
| Measurement | Basque | Immigrants from Liberia |
| Minimum | 0.20% | 0.48% |
| Maximum | 35.0% | 5.7% |
| Range | 34.8% | 5.2% |
| Mean | 3.4% | 2.6% |
| Median | 2.4% | 2.5% |
| Interquartile 25% (IQ1) | 0.99% | 2.1% |
| Interquartile 75% (IQ3) | 3.4% | 2.9% |
| Interquartile Range (IQR) | 2.4% | 0.86% |
| Standard Deviation (Sample) | 5.0% | 1.0% |
| Standard Deviation (Population) | 4.9% | 1.0% |
Demographics Similar to Basques and Immigrants from Liberia by Single Father Households
In terms of single father households, the demographic groups most similar to Basques are Native Hawaiian (2.5%, a difference of 0.020%), Delaware (2.5%, a difference of 0.030%), Bahamian (2.5%, a difference of 0.080%), Immigrants from Cameroon (2.5%, a difference of 0.16%), and Immigrants from Middle Africa (2.5%, a difference of 0.21%). Similarly, the demographic groups most similar to Immigrants from Liberia are Dominican (2.5%, a difference of 0.13%), Immigrants from Belize (2.5%, a difference of 0.15%), Immigrants from Caribbean (2.5%, a difference of 0.31%), Comanche (2.5%, a difference of 0.40%), and Spanish (2.5%, a difference of 0.55%).
| Demographics | Rating | Rank | Single Father Households |
| Spaniards | 3.1 /100 | #243 | Tragic 2.5% |
| Immigrants | Middle Africa | 2.8 /100 | #244 | Tragic 2.5% |
| Basques | 2.5 /100 | #245 | Tragic 2.5% |
| Native Hawaiians | 2.5 /100 | #246 | Tragic 2.5% |
| Delaware | 2.5 /100 | #247 | Tragic 2.5% |
| Bahamians | 2.4 /100 | #248 | Tragic 2.5% |
| Immigrants | Cameroon | 2.3 /100 | #249 | Tragic 2.5% |
| Somalis | 2.1 /100 | #250 | Tragic 2.5% |
| Liberians | 2.0 /100 | #251 | Tragic 2.5% |
| Immigrants | Eritrea | 2.0 /100 | #252 | Tragic 2.5% |
| Immigrants | Somalia | 1.9 /100 | #253 | Tragic 2.5% |
| Immigrants | Thailand | 1.8 /100 | #254 | Tragic 2.5% |
| Tongans | 1.5 /100 | #255 | Tragic 2.5% |
| Potawatomi | 1.4 /100 | #256 | Tragic 2.5% |
| Immigrants | Congo | 1.2 /100 | #257 | Tragic 2.5% |
| Spanish | 1.1 /100 | #258 | Tragic 2.5% |
| Comanche | 1.0 /100 | #259 | Tragic 2.5% |
| Immigrants | Caribbean | 1.0 /100 | #260 | Tragic 2.5% |
| Immigrants | Belize | 0.9 /100 | #261 | Tragic 2.5% |
| Immigrants | Liberia | 0.8 /100 | #262 | Tragic 2.5% |
| Dominicans | 0.8 /100 | #263 | Tragic 2.5% |