Bulgarian vs Immigrants from Liberia Single Father Households
COMPARE
Bulgarian
Immigrants from Liberia
Single Father Households
Single Father Households Comparison
Bulgarians
Immigrants from Liberia
2.0%
SINGLE FATHER HOUSEHOLDS
100.0/ 100
METRIC RATING
29th/ 347
METRIC RANK
2.5%
SINGLE FATHER HOUSEHOLDS
0.8/ 100
METRIC RATING
262nd/ 347
METRIC RANK
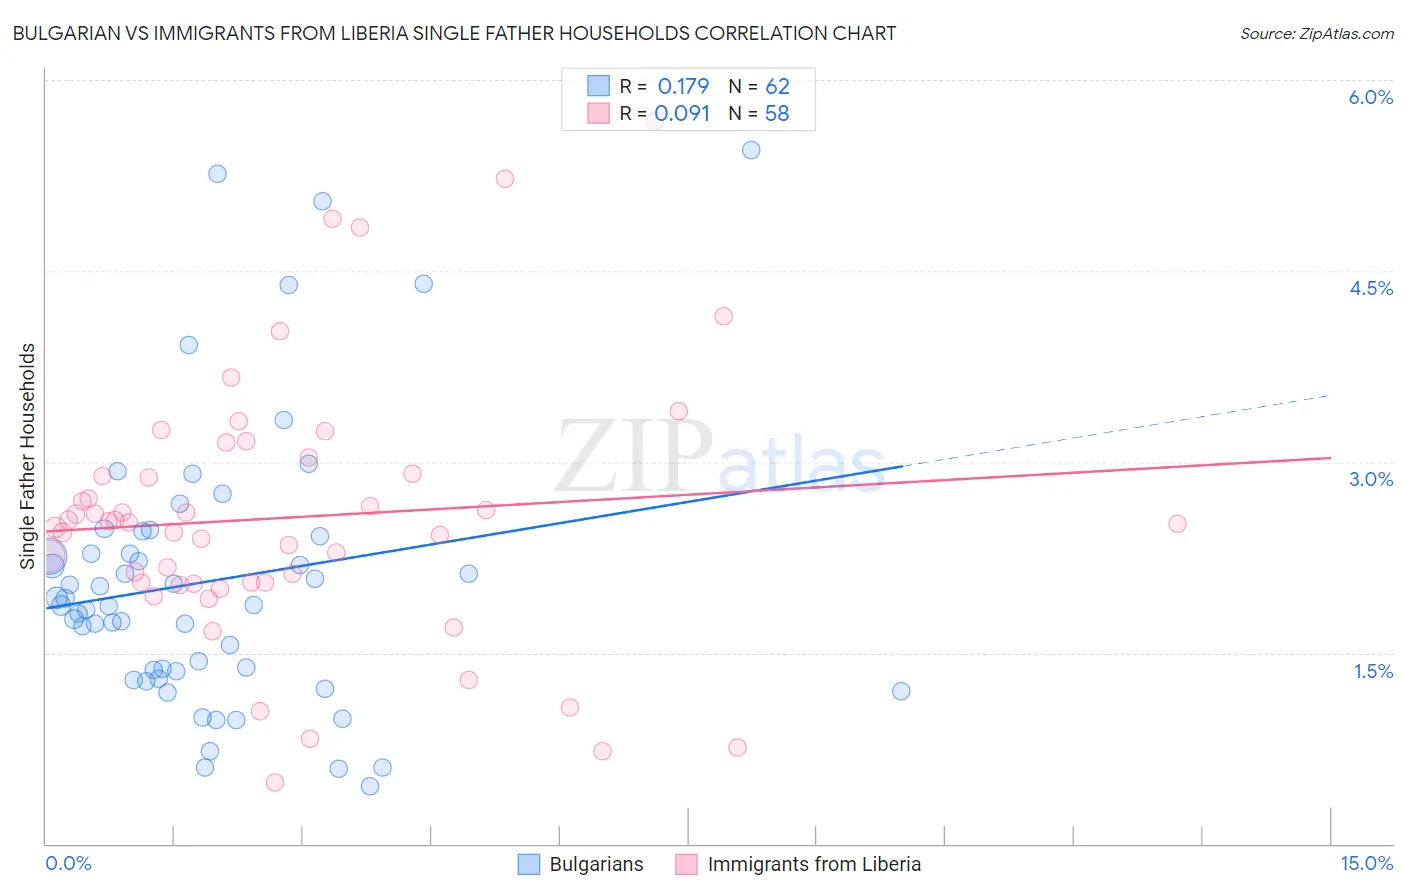
Bulgarian vs Immigrants from Liberia Single Father Households Correlation Chart
The statistical analysis conducted on geographies consisting of 204,652,646 people shows a poor positive correlation between the proportion of Bulgarians and percentage of single father households in the United States with a correlation coefficient (R) of 0.179 and weighted average of 2.0%. Similarly, the statistical analysis conducted on geographies consisting of 135,021,934 people shows a slight positive correlation between the proportion of Immigrants from Liberia and percentage of single father households in the United States with a correlation coefficient (R) of 0.091 and weighted average of 2.5%, a difference of 29.1%.
Single Father Households Correlation Summary
| Measurement | Bulgarian | Immigrants from Liberia |
| Minimum | 0.45% | 0.48% |
| Maximum | 5.5% | 5.7% |
| Range | 5.0% | 5.2% |
| Mean | 2.1% | 2.6% |
| Median | 1.9% | 2.5% |
| Interquartile 25% (IQ1) | 1.4% | 2.1% |
| Interquartile 75% (IQ3) | 2.4% | 2.9% |
| Interquartile Range (IQR) | 1.1% | 0.86% |
| Standard Deviation (Sample) | 1.1% | 1.0% |
| Standard Deviation (Population) | 1.1% | 1.0% |
Similar Demographics by Single Father Households
Demographics Similar to Bulgarians by Single Father Households
In terms of single father households, the demographic groups most similar to Bulgarians are Cambodian (2.0%, a difference of 0.020%), Israeli (2.0%, a difference of 0.050%), Immigrants from Japan (2.0%, a difference of 0.090%), Chinese (2.0%, a difference of 0.090%), and Immigrants from South Central Asia (2.0%, a difference of 0.27%).
| Demographics | Rating | Rank | Single Father Households |
| Immigrants | Latvia | 100.0 /100 | #22 | Exceptional 1.9% |
| Immigrants | Croatia | 100.0 /100 | #23 | Exceptional 2.0% |
| Immigrants | Russia | 100.0 /100 | #24 | Exceptional 2.0% |
| Eastern Europeans | 100.0 /100 | #25 | Exceptional 2.0% |
| Assyrians/Chaldeans/Syriacs | 100.0 /100 | #26 | Exceptional 2.0% |
| Immigrants | South Central Asia | 100.0 /100 | #27 | Exceptional 2.0% |
| Immigrants | Japan | 100.0 /100 | #28 | Exceptional 2.0% |
| Bulgarians | 100.0 /100 | #29 | Exceptional 2.0% |
| Cambodians | 100.0 /100 | #30 | Exceptional 2.0% |
| Israelis | 100.0 /100 | #31 | Exceptional 2.0% |
| Chinese | 100.0 /100 | #32 | Exceptional 2.0% |
| Turks | 100.0 /100 | #33 | Exceptional 2.0% |
| Immigrants | Australia | 100.0 /100 | #34 | Exceptional 2.0% |
| Albanians | 100.0 /100 | #35 | Exceptional 2.0% |
| Immigrants | Belgium | 100.0 /100 | #36 | Exceptional 2.0% |
Demographics Similar to Immigrants from Liberia by Single Father Households
In terms of single father households, the demographic groups most similar to Immigrants from Liberia are Dominican (2.5%, a difference of 0.13%), Immigrants from Belize (2.5%, a difference of 0.15%), Immigrants from Caribbean (2.5%, a difference of 0.31%), Comanche (2.5%, a difference of 0.40%), and Spanish (2.5%, a difference of 0.55%).
| Demographics | Rating | Rank | Single Father Households |
| Tongans | 1.5 /100 | #255 | Tragic 2.5% |
| Potawatomi | 1.4 /100 | #256 | Tragic 2.5% |
| Immigrants | Congo | 1.2 /100 | #257 | Tragic 2.5% |
| Spanish | 1.1 /100 | #258 | Tragic 2.5% |
| Comanche | 1.0 /100 | #259 | Tragic 2.5% |
| Immigrants | Caribbean | 1.0 /100 | #260 | Tragic 2.5% |
| Immigrants | Belize | 0.9 /100 | #261 | Tragic 2.5% |
| Immigrants | Liberia | 0.8 /100 | #262 | Tragic 2.5% |
| Dominicans | 0.8 /100 | #263 | Tragic 2.5% |
| Indonesians | 0.5 /100 | #264 | Tragic 2.6% |
| Immigrants | Micronesia | 0.5 /100 | #265 | Tragic 2.6% |
| French American Indians | 0.5 /100 | #266 | Tragic 2.6% |
| Guamanians/Chamorros | 0.4 /100 | #267 | Tragic 2.6% |
| Haitians | 0.4 /100 | #268 | Tragic 2.6% |
| Cubans | 0.3 /100 | #269 | Tragic 2.6% |