Celtic vs Immigrants from Liberia Single Father Households
COMPARE
Celtic
Immigrants from Liberia
Single Father Households
Single Father Households Comparison
Celtics
Immigrants from Liberia
2.3%
SINGLE FATHER HOUSEHOLDS
55.4/ 100
METRIC RATING
173rd/ 347
METRIC RANK
2.5%
SINGLE FATHER HOUSEHOLDS
0.8/ 100
METRIC RATING
262nd/ 347
METRIC RANK
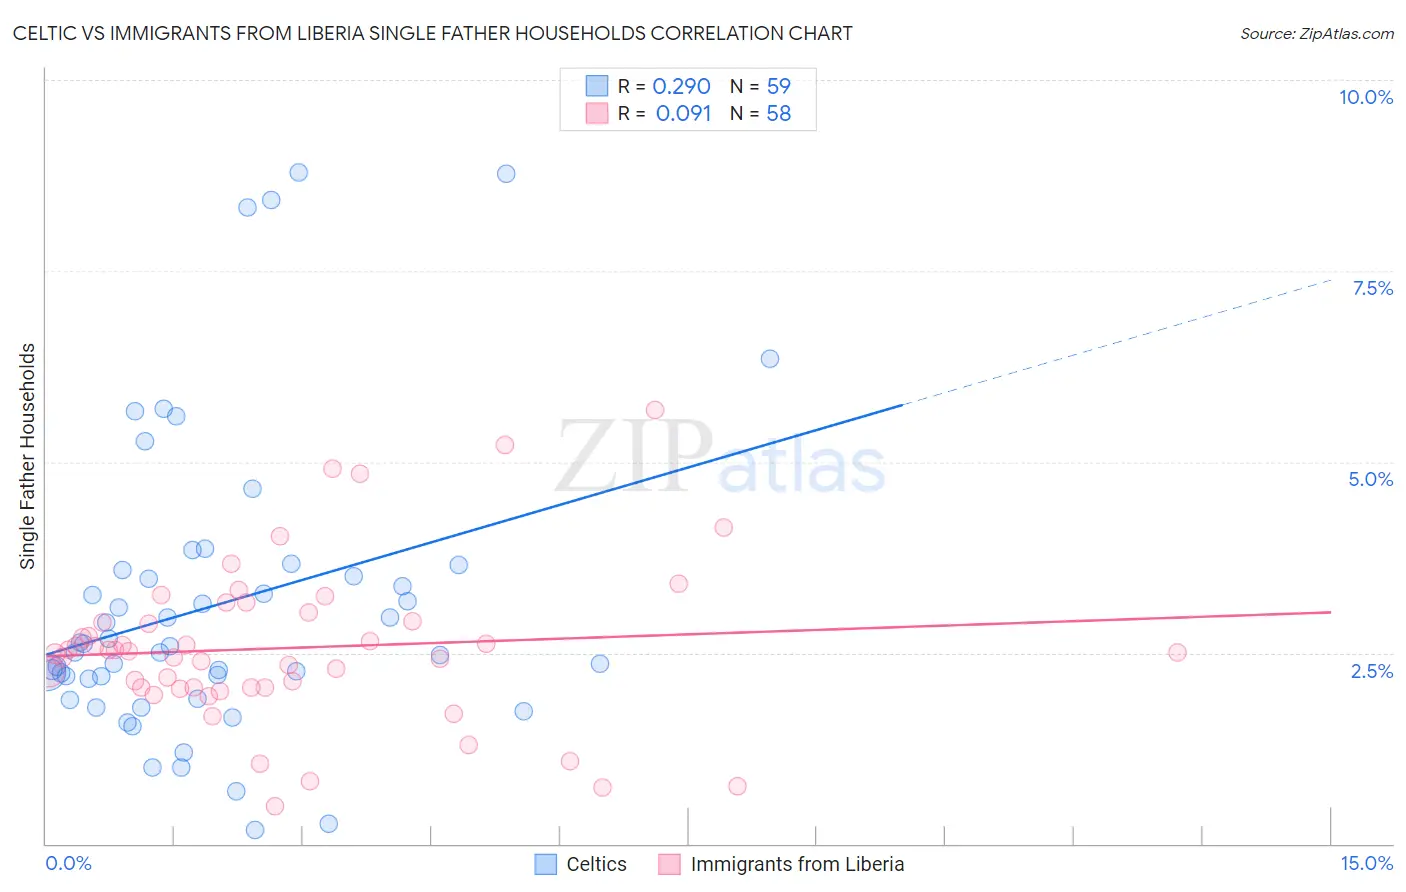
Celtic vs Immigrants from Liberia Single Father Households Correlation Chart
The statistical analysis conducted on geographies consisting of 168,269,233 people shows a weak positive correlation between the proportion of Celtics and percentage of single father households in the United States with a correlation coefficient (R) of 0.290 and weighted average of 2.3%. Similarly, the statistical analysis conducted on geographies consisting of 135,021,934 people shows a slight positive correlation between the proportion of Immigrants from Liberia and percentage of single father households in the United States with a correlation coefficient (R) of 0.091 and weighted average of 2.5%, a difference of 9.2%.
Single Father Households Correlation Summary
| Measurement | Celtic | Immigrants from Liberia |
| Minimum | 0.17% | 0.48% |
| Maximum | 8.8% | 5.7% |
| Range | 8.6% | 5.2% |
| Mean | 3.1% | 2.6% |
| Median | 2.6% | 2.5% |
| Interquartile 25% (IQ1) | 2.2% | 2.1% |
| Interquartile 75% (IQ3) | 3.6% | 2.9% |
| Interquartile Range (IQR) | 1.4% | 0.86% |
| Standard Deviation (Sample) | 1.9% | 1.0% |
| Standard Deviation (Population) | 1.9% | 1.0% |
Similar Demographics by Single Father Households
Demographics Similar to Celtics by Single Father Households
In terms of single father households, the demographic groups most similar to Celtics are Czechoslovakian (2.3%, a difference of 0.26%), Afghan (2.3%, a difference of 0.40%), Swedish (2.3%, a difference of 0.47%), Immigrants from Jamaica (2.3%, a difference of 0.47%), and Ugandan (2.3%, a difference of 0.52%).
| Demographics | Rating | Rank | Single Father Households |
| English | 68.6 /100 | #166 | Good 2.3% |
| South Americans | 64.3 /100 | #167 | Good 2.3% |
| Icelanders | 63.1 /100 | #168 | Good 2.3% |
| Czechs | 62.5 /100 | #169 | Good 2.3% |
| Ugandans | 62.2 /100 | #170 | Good 2.3% |
| Swedes | 61.6 /100 | #171 | Good 2.3% |
| Czechoslovakians | 58.9 /100 | #172 | Average 2.3% |
| Celtics | 55.4 /100 | #173 | Average 2.3% |
| Afghans | 50.0 /100 | #174 | Average 2.3% |
| Immigrants | Jamaica | 49.1 /100 | #175 | Average 2.3% |
| Danes | 48.2 /100 | #176 | Average 2.3% |
| Colombians | 48.0 /100 | #177 | Average 2.3% |
| Costa Ricans | 44.1 /100 | #178 | Average 2.3% |
| Welsh | 44.0 /100 | #179 | Average 2.3% |
| Yugoslavians | 43.9 /100 | #180 | Average 2.3% |
Demographics Similar to Immigrants from Liberia by Single Father Households
In terms of single father households, the demographic groups most similar to Immigrants from Liberia are Dominican (2.5%, a difference of 0.13%), Immigrants from Belize (2.5%, a difference of 0.15%), Immigrants from Caribbean (2.5%, a difference of 0.31%), Comanche (2.5%, a difference of 0.40%), and Spanish (2.5%, a difference of 0.55%).
| Demographics | Rating | Rank | Single Father Households |
| Tongans | 1.5 /100 | #255 | Tragic 2.5% |
| Potawatomi | 1.4 /100 | #256 | Tragic 2.5% |
| Immigrants | Congo | 1.2 /100 | #257 | Tragic 2.5% |
| Spanish | 1.1 /100 | #258 | Tragic 2.5% |
| Comanche | 1.0 /100 | #259 | Tragic 2.5% |
| Immigrants | Caribbean | 1.0 /100 | #260 | Tragic 2.5% |
| Immigrants | Belize | 0.9 /100 | #261 | Tragic 2.5% |
| Immigrants | Liberia | 0.8 /100 | #262 | Tragic 2.5% |
| Dominicans | 0.8 /100 | #263 | Tragic 2.5% |
| Indonesians | 0.5 /100 | #264 | Tragic 2.6% |
| Immigrants | Micronesia | 0.5 /100 | #265 | Tragic 2.6% |
| French American Indians | 0.5 /100 | #266 | Tragic 2.6% |
| Guamanians/Chamorros | 0.4 /100 | #267 | Tragic 2.6% |
| Haitians | 0.4 /100 | #268 | Tragic 2.6% |
| Cubans | 0.3 /100 | #269 | Tragic 2.6% |