Croatian vs Immigrants from Liberia No Schooling Completed
COMPARE
Croatian
Immigrants from Liberia
No Schooling Completed
No Schooling Completed Comparison
Croatians
Immigrants from Liberia
1.5%
NO SCHOOLING COMPLETED
100.0/ 100
METRIC RATING
17th/ 347
METRIC RANK
2.5%
NO SCHOOLING COMPLETED
0.4/ 100
METRIC RATING
263rd/ 347
METRIC RANK
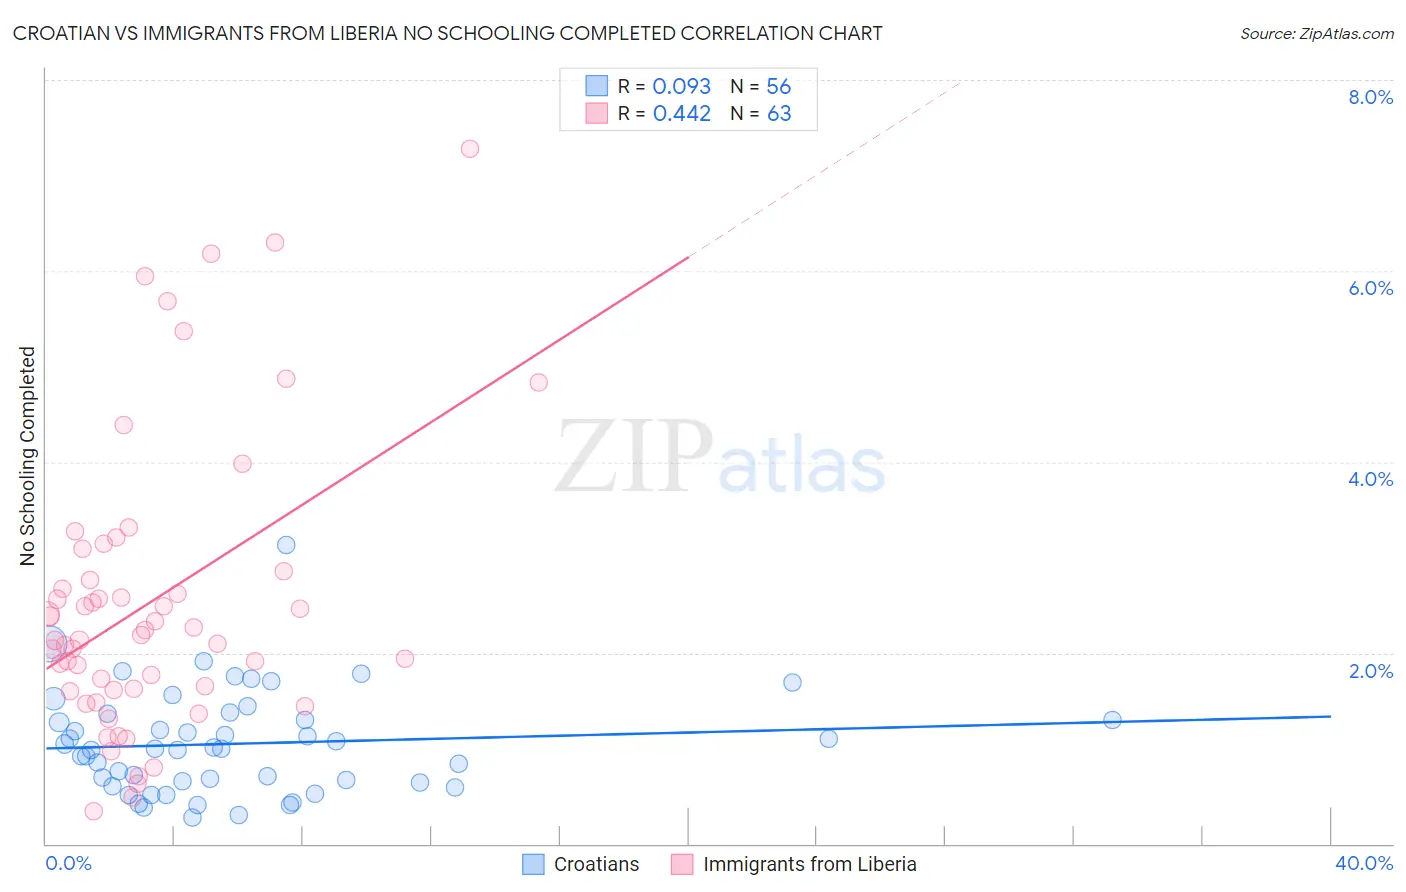
Croatian vs Immigrants from Liberia No Schooling Completed Correlation Chart
The statistical analysis conducted on geographies consisting of 370,650,548 people shows a slight positive correlation between the proportion of Croatians and percentage of population with no schooling in the United States with a correlation coefficient (R) of 0.093 and weighted average of 1.5%. Similarly, the statistical analysis conducted on geographies consisting of 134,971,169 people shows a moderate positive correlation between the proportion of Immigrants from Liberia and percentage of population with no schooling in the United States with a correlation coefficient (R) of 0.442 and weighted average of 2.5%, a difference of 69.3%.
No Schooling Completed Correlation Summary
| Measurement | Croatian | Immigrants from Liberia |
| Minimum | 0.27% | 0.34% |
| Maximum | 3.1% | 7.3% |
| Range | 2.9% | 6.9% |
| Mean | 1.0% | 2.5% |
| Median | 1.0% | 2.2% |
| Interquartile 25% (IQ1) | 0.65% | 1.6% |
| Interquartile 75% (IQ3) | 1.3% | 2.9% |
| Interquartile Range (IQR) | 0.68% | 1.2% |
| Standard Deviation (Sample) | 0.54% | 1.5% |
| Standard Deviation (Population) | 0.54% | 1.5% |
Similar Demographics by No Schooling Completed
Demographics Similar to Croatians by No Schooling Completed
In terms of no schooling completed, the demographic groups most similar to Croatians are Finnish (1.5%, a difference of 0.010%), Danish (1.5%, a difference of 0.30%), Alaskan Athabascan (1.5%, a difference of 0.41%), Tlingit-Haida (1.5%, a difference of 0.53%), and Welsh (1.5%, a difference of 0.53%).
| Demographics | Rating | Rank | No Schooling Completed |
| Dutch | 100.0 /100 | #10 | Exceptional 1.4% |
| Lithuanians | 100.0 /100 | #11 | Exceptional 1.4% |
| Irish | 100.0 /100 | #12 | Exceptional 1.4% |
| Poles | 100.0 /100 | #13 | Exceptional 1.4% |
| Scotch-Irish | 100.0 /100 | #14 | Exceptional 1.5% |
| Tlingit-Haida | 100.0 /100 | #15 | Exceptional 1.5% |
| Finns | 100.0 /100 | #16 | Exceptional 1.5% |
| Croatians | 100.0 /100 | #17 | Exceptional 1.5% |
| Danes | 100.0 /100 | #18 | Exceptional 1.5% |
| Alaskan Athabascans | 100.0 /100 | #19 | Exceptional 1.5% |
| Welsh | 100.0 /100 | #20 | Exceptional 1.5% |
| Chinese | 100.0 /100 | #21 | Exceptional 1.5% |
| Alaska Natives | 100.0 /100 | #22 | Exceptional 1.5% |
| Europeans | 100.0 /100 | #23 | Exceptional 1.5% |
| Pennsylvania Germans | 100.0 /100 | #24 | Exceptional 1.5% |
Demographics Similar to Immigrants from Liberia by No Schooling Completed
In terms of no schooling completed, the demographic groups most similar to Immigrants from Liberia are Indian (Asian) (2.5%, a difference of 0.13%), Immigrants from Sierra Leone (2.5%, a difference of 0.17%), West Indian (2.5%, a difference of 0.31%), Fijian (2.5%, a difference of 0.39%), and Armenian (2.5%, a difference of 0.52%).
| Demographics | Rating | Rank | No Schooling Completed |
| Yaqui | 0.8 /100 | #256 | Tragic 2.4% |
| Immigrants | South America | 0.6 /100 | #257 | Tragic 2.5% |
| Assyrians/Chaldeans/Syriacs | 0.6 /100 | #258 | Tragic 2.5% |
| Immigrants | Jamaica | 0.6 /100 | #259 | Tragic 2.5% |
| Immigrants | Ethiopia | 0.6 /100 | #260 | Tragic 2.5% |
| Armenians | 0.5 /100 | #261 | Tragic 2.5% |
| Immigrants | Sierra Leone | 0.5 /100 | #262 | Tragic 2.5% |
| Immigrants | Liberia | 0.4 /100 | #263 | Tragic 2.5% |
| Indians (Asian) | 0.4 /100 | #264 | Tragic 2.5% |
| West Indians | 0.4 /100 | #265 | Tragic 2.5% |
| Fijians | 0.4 /100 | #266 | Tragic 2.5% |
| Yuman | 0.4 /100 | #267 | Tragic 2.5% |
| Taiwanese | 0.3 /100 | #268 | Tragic 2.5% |
| Immigrants | Nigeria | 0.2 /100 | #269 | Tragic 2.5% |
| Immigrants | Peru | 0.2 /100 | #270 | Tragic 2.5% |