Creek vs Thai Family Households
COMPARE
Creek
Thai
Family Households
Family Households Comparison
Creek
Thais
64.2%
FAMILY HOUSEHOLDS
34.1/ 100
METRIC RATING
183rd/ 347
METRIC RANK
67.2%
FAMILY HOUSEHOLDS
100.0/ 100
METRIC RATING
34th/ 347
METRIC RANK
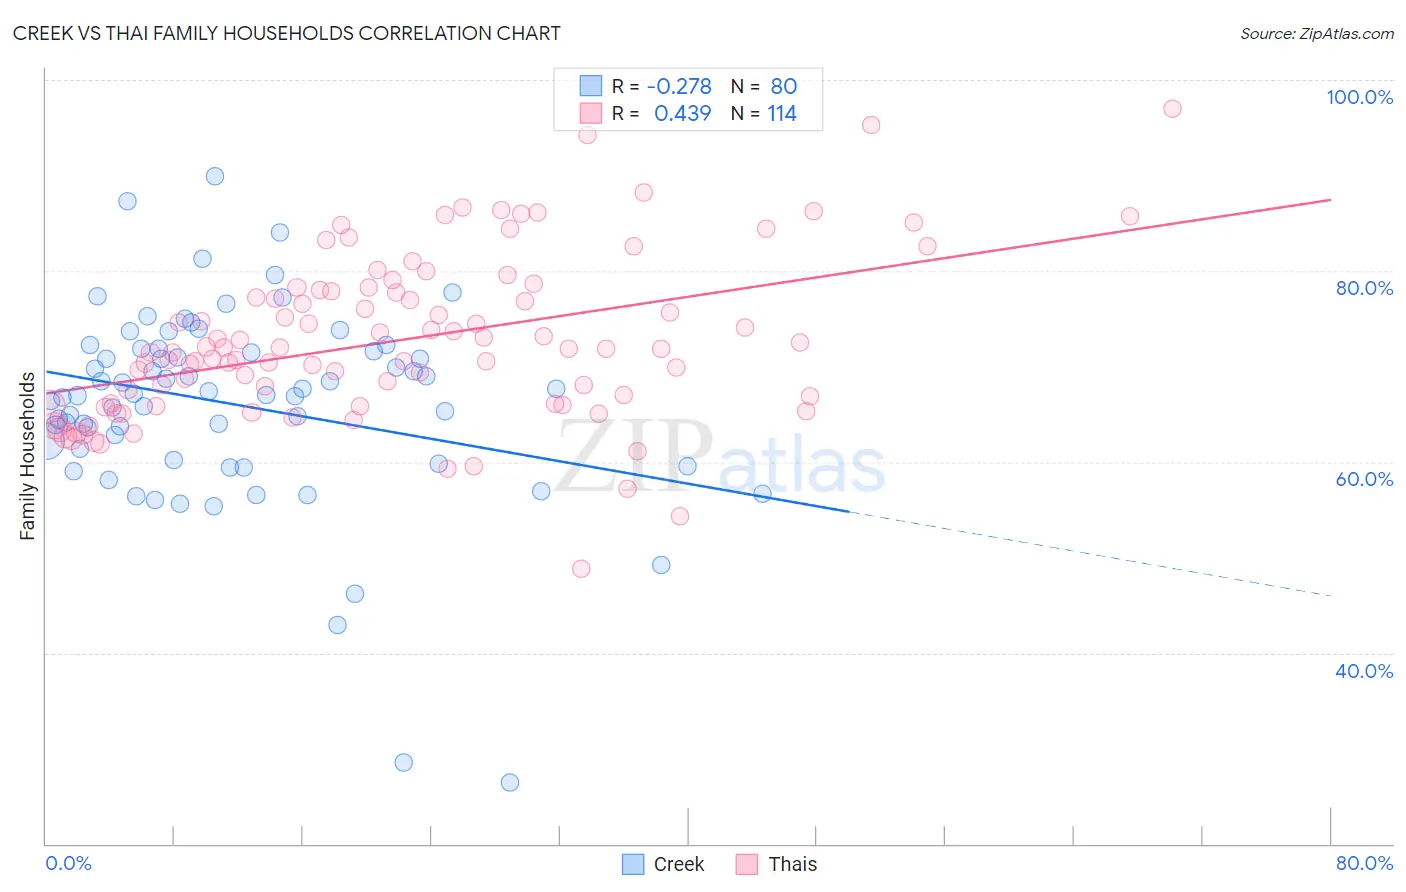
Creek vs Thai Family Households Correlation Chart
The statistical analysis conducted on geographies consisting of 178,433,480 people shows a weak negative correlation between the proportion of Creek and percentage of family households in the United States with a correlation coefficient (R) of -0.278 and weighted average of 64.2%. Similarly, the statistical analysis conducted on geographies consisting of 475,372,793 people shows a moderate positive correlation between the proportion of Thais and percentage of family households in the United States with a correlation coefficient (R) of 0.439 and weighted average of 67.2%, a difference of 4.7%.
Family Households Correlation Summary
| Measurement | Creek | Thai |
| Minimum | 26.4% | 48.8% |
| Maximum | 89.9% | 97.0% |
| Range | 63.5% | 48.2% |
| Mean | 66.0% | 72.7% |
| Median | 67.1% | 71.8% |
| Interquartile 25% (IQ1) | 60.8% | 66.1% |
| Interquartile 75% (IQ3) | 71.7% | 77.9% |
| Interquartile Range (IQR) | 10.9% | 11.8% |
| Standard Deviation (Sample) | 10.4% | 8.6% |
| Standard Deviation (Population) | 10.3% | 8.5% |
Similar Demographics by Family Households
Demographics Similar to Creek by Family Households
In terms of family households, the demographic groups most similar to Creek are Immigrants from Honduras (64.2%, a difference of 0.010%), Immigrants from Trinidad and Tobago (64.2%, a difference of 0.010%), Ukrainian (64.2%, a difference of 0.010%), Puerto Rican (64.2%, a difference of 0.010%), and Immigrants from Ukraine (64.2%, a difference of 0.060%).
| Demographics | Rating | Rank | Family Households |
| Vietnamese | 43.6 /100 | #176 | Average 64.2% |
| Immigrants | Micronesia | 42.3 /100 | #177 | Average 64.2% |
| Jamaicans | 40.6 /100 | #178 | Average 64.2% |
| Immigrants | Ukraine | 38.2 /100 | #179 | Fair 64.2% |
| Immigrants | Honduras | 35.0 /100 | #180 | Fair 64.2% |
| Immigrants | Trinidad and Tobago | 34.9 /100 | #181 | Fair 64.2% |
| Ukrainians | 34.6 /100 | #182 | Fair 64.2% |
| Creek | 34.1 /100 | #183 | Fair 64.2% |
| Puerto Ricans | 33.4 /100 | #184 | Fair 64.2% |
| Immigrants | Iran | 30.4 /100 | #185 | Fair 64.1% |
| Spanish Americans | 30.1 /100 | #186 | Fair 64.1% |
| Northern Europeans | 28.2 /100 | #187 | Fair 64.1% |
| Paraguayans | 26.7 /100 | #188 | Fair 64.1% |
| Immigrants | Western Asia | 25.3 /100 | #189 | Fair 64.1% |
| Zimbabweans | 24.7 /100 | #190 | Fair 64.1% |
Demographics Similar to Thais by Family Households
In terms of family households, the demographic groups most similar to Thais are Salvadoran (67.2%, a difference of 0.0%), Nepalese (67.2%, a difference of 0.040%), Tohono O'odham (67.1%, a difference of 0.050%), Peruvian (67.1%, a difference of 0.060%), and Immigrants from Latin America (67.2%, a difference of 0.10%).
| Demographics | Rating | Rank | Family Households |
| Hispanics or Latinos | 100.0 /100 | #27 | Exceptional 67.4% |
| Hawaiians | 100.0 /100 | #28 | Exceptional 67.4% |
| Nicaraguans | 100.0 /100 | #29 | Exceptional 67.4% |
| Immigrants | Peru | 100.0 /100 | #30 | Exceptional 67.2% |
| Immigrants | Latin America | 100.0 /100 | #31 | Exceptional 67.2% |
| Nepalese | 100.0 /100 | #32 | Exceptional 67.2% |
| Salvadorans | 100.0 /100 | #33 | Exceptional 67.2% |
| Thais | 100.0 /100 | #34 | Exceptional 67.2% |
| Tohono O'odham | 100.0 /100 | #35 | Exceptional 67.1% |
| Peruvians | 100.0 /100 | #36 | Exceptional 67.1% |
| Tsimshian | 100.0 /100 | #37 | Exceptional 67.1% |
| Mexican American Indians | 100.0 /100 | #38 | Exceptional 67.0% |
| Immigrants | El Salvador | 100.0 /100 | #39 | Exceptional 67.0% |
| Guamanians/Chamorros | 100.0 /100 | #40 | Exceptional 66.6% |
| Immigrants | Bolivia | 100.0 /100 | #41 | Exceptional 66.6% |