Creek vs Immigrants from Southern Europe Family Households
COMPARE
Creek
Immigrants from Southern Europe
Family Households
Family Households Comparison
Creek
Immigrants from Southern Europe
64.2%
FAMILY HOUSEHOLDS
34.1/ 100
METRIC RATING
183rd/ 347
METRIC RANK
64.4%
FAMILY HOUSEHOLDS
60.0/ 100
METRIC RATING
165th/ 347
METRIC RANK
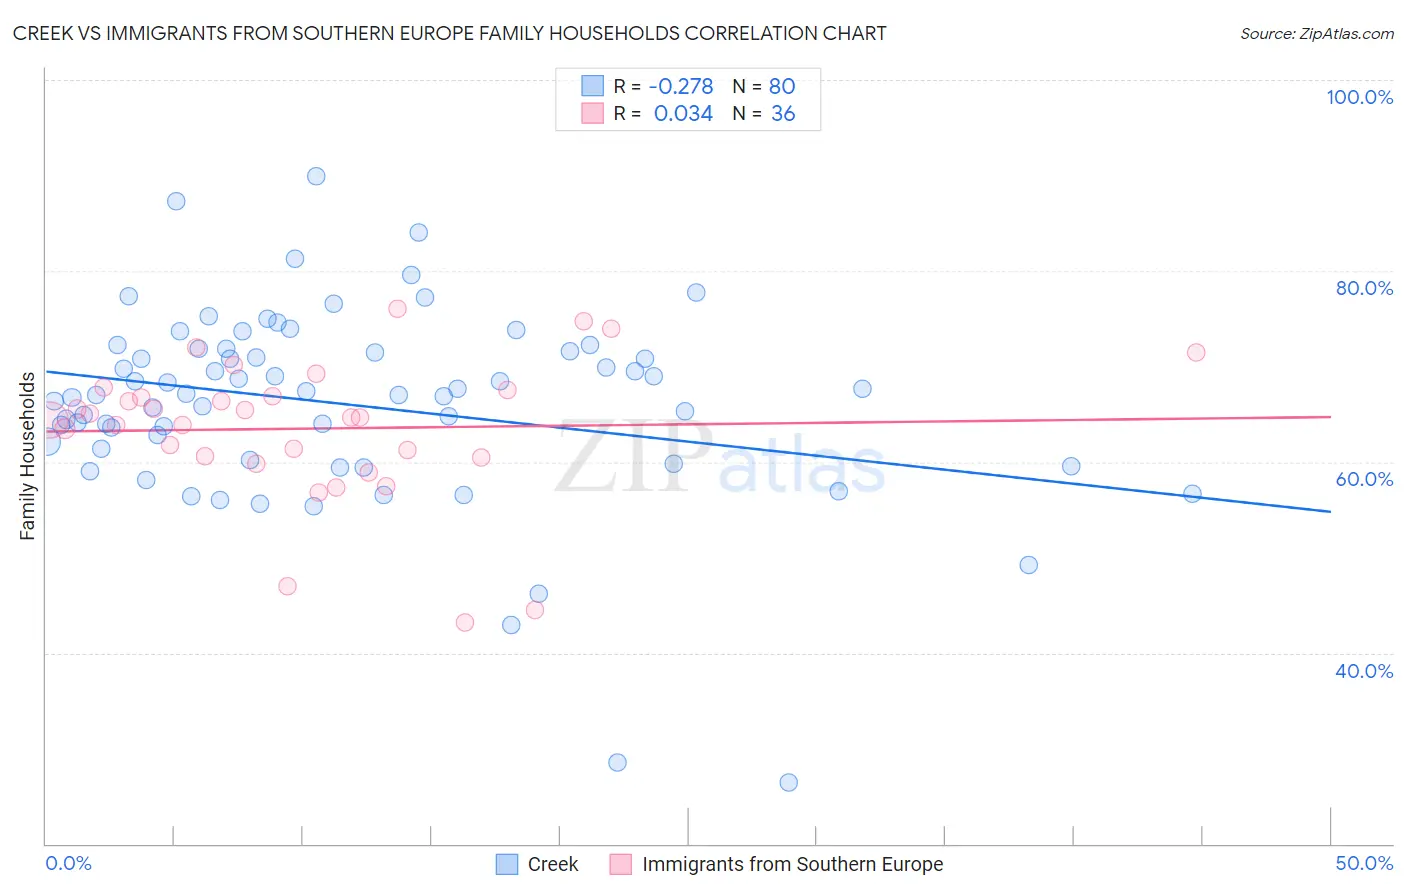
Creek vs Immigrants from Southern Europe Family Households Correlation Chart
The statistical analysis conducted on geographies consisting of 178,433,480 people shows a weak negative correlation between the proportion of Creek and percentage of family households in the United States with a correlation coefficient (R) of -0.278 and weighted average of 64.2%. Similarly, the statistical analysis conducted on geographies consisting of 402,628,805 people shows no correlation between the proportion of Immigrants from Southern Europe and percentage of family households in the United States with a correlation coefficient (R) of 0.034 and weighted average of 64.4%, a difference of 0.36%.
Family Households Correlation Summary
| Measurement | Creek | Immigrants from Southern Europe |
| Minimum | 26.4% | 43.1% |
| Maximum | 89.9% | 76.0% |
| Range | 63.5% | 32.9% |
| Mean | 66.0% | 63.5% |
| Median | 67.1% | 64.7% |
| Interquartile 25% (IQ1) | 60.8% | 60.5% |
| Interquartile 75% (IQ3) | 71.7% | 67.2% |
| Interquartile Range (IQR) | 10.9% | 6.7% |
| Standard Deviation (Sample) | 10.4% | 7.4% |
| Standard Deviation (Population) | 10.3% | 7.3% |
Demographics Similar to Creek and Immigrants from Southern Europe by Family Households
In terms of family households, the demographic groups most similar to Creek are Immigrants from Honduras (64.2%, a difference of 0.010%), Immigrants from Trinidad and Tobago (64.2%, a difference of 0.010%), Ukrainian (64.2%, a difference of 0.010%), Puerto Rican (64.2%, a difference of 0.010%), and Immigrants from Ukraine (64.2%, a difference of 0.060%). Similarly, the demographic groups most similar to Immigrants from Southern Europe are Immigrants from Nigeria (64.4%, a difference of 0.0%), Scotch-Irish (64.4%, a difference of 0.010%), Irish (64.4%, a difference of 0.030%), Honduran (64.4%, a difference of 0.040%), and Iraqi (64.4%, a difference of 0.060%).
| Demographics | Rating | Rank | Family Households |
| Immigrants | Nigeria | 60.1 /100 | #164 | Good 64.4% |
| Immigrants | Southern Europe | 60.0 /100 | #165 | Good 64.4% |
| Scotch-Irish | 59.2 /100 | #166 | Average 64.4% |
| Irish | 57.9 /100 | #167 | Average 64.4% |
| Hondurans | 57.5 /100 | #168 | Average 64.4% |
| Iraqis | 56.0 /100 | #169 | Average 64.4% |
| Armenians | 55.9 /100 | #170 | Average 64.4% |
| Ute | 54.6 /100 | #171 | Average 64.3% |
| Dutch West Indians | 53.9 /100 | #172 | Average 64.3% |
| Immigrants | Sierra Leone | 52.5 /100 | #173 | Average 64.3% |
| Immigrants | Germany | 50.0 /100 | #174 | Average 64.3% |
| Bangladeshis | 44.3 /100 | #175 | Average 64.3% |
| Vietnamese | 43.6 /100 | #176 | Average 64.2% |
| Immigrants | Micronesia | 42.3 /100 | #177 | Average 64.2% |
| Jamaicans | 40.6 /100 | #178 | Average 64.2% |
| Immigrants | Ukraine | 38.2 /100 | #179 | Fair 64.2% |
| Immigrants | Honduras | 35.0 /100 | #180 | Fair 64.2% |
| Immigrants | Trinidad and Tobago | 34.9 /100 | #181 | Fair 64.2% |
| Ukrainians | 34.6 /100 | #182 | Fair 64.2% |
| Creek | 34.1 /100 | #183 | Fair 64.2% |
| Puerto Ricans | 33.4 /100 | #184 | Fair 64.2% |