Creek vs Immigrants from Guyana Family Households
COMPARE
Creek
Immigrants from Guyana
Family Households
Family Households Comparison
Creek
Immigrants from Guyana
64.2%
FAMILY HOUSEHOLDS
34.1/ 100
METRIC RATING
183rd/ 347
METRIC RANK
65.5%
FAMILY HOUSEHOLDS
99.6/ 100
METRIC RATING
83rd/ 347
METRIC RANK
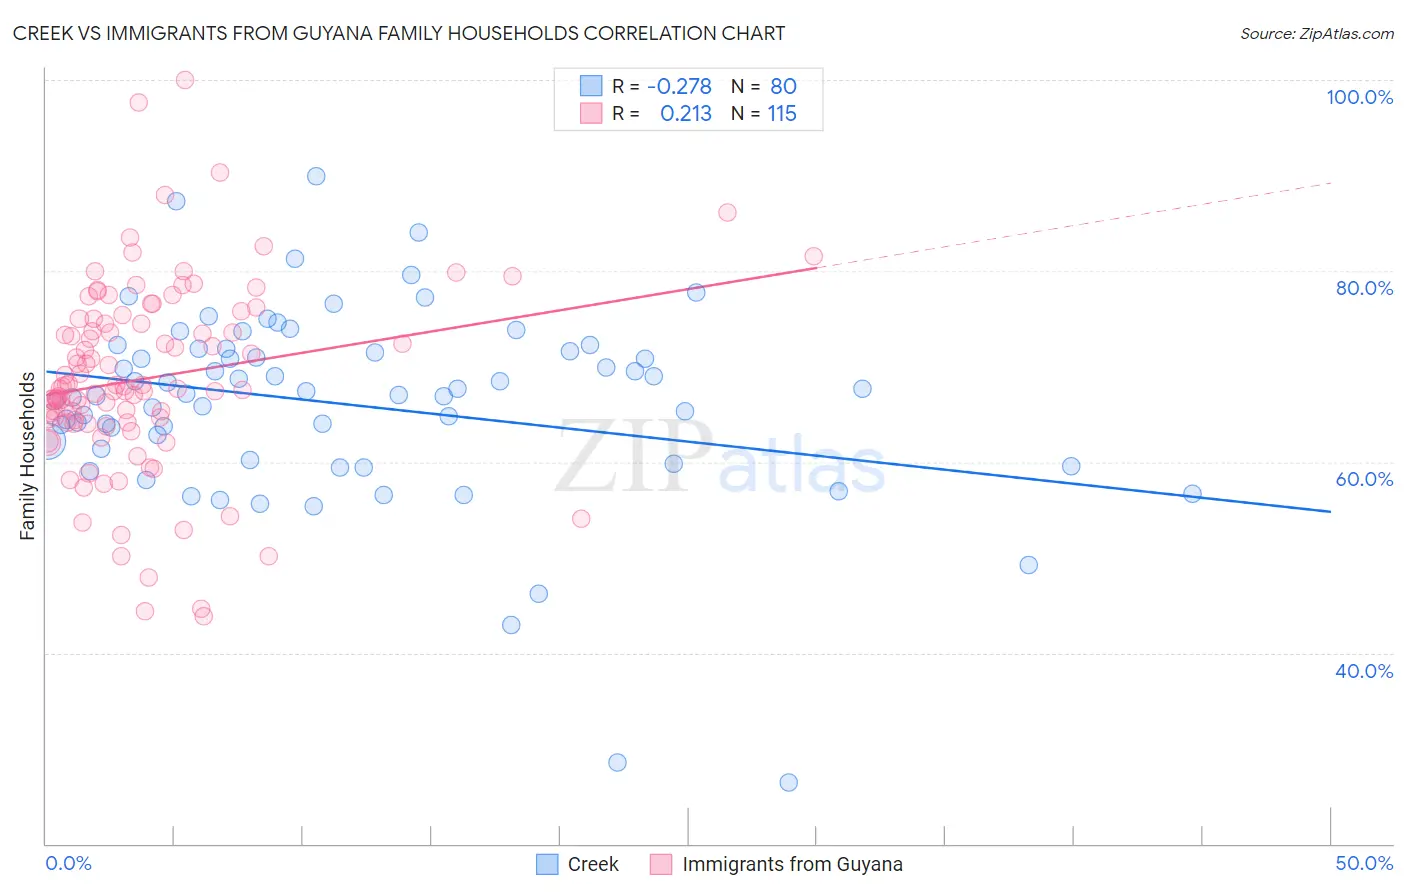
Creek vs Immigrants from Guyana Family Households Correlation Chart
The statistical analysis conducted on geographies consisting of 178,433,480 people shows a weak negative correlation between the proportion of Creek and percentage of family households in the United States with a correlation coefficient (R) of -0.278 and weighted average of 64.2%. Similarly, the statistical analysis conducted on geographies consisting of 183,692,890 people shows a weak positive correlation between the proportion of Immigrants from Guyana and percentage of family households in the United States with a correlation coefficient (R) of 0.213 and weighted average of 65.5%, a difference of 2.1%.
Family Households Correlation Summary
| Measurement | Creek | Immigrants from Guyana |
| Minimum | 26.4% | 43.8% |
| Maximum | 89.9% | 100.0% |
| Range | 63.5% | 56.2% |
| Mean | 66.0% | 68.8% |
| Median | 67.1% | 67.6% |
| Interquartile 25% (IQ1) | 60.8% | 64.1% |
| Interquartile 75% (IQ3) | 71.7% | 74.9% |
| Interquartile Range (IQR) | 10.9% | 10.8% |
| Standard Deviation (Sample) | 10.4% | 9.8% |
| Standard Deviation (Population) | 10.3% | 9.8% |
Similar Demographics by Family Households
Demographics Similar to Creek by Family Households
In terms of family households, the demographic groups most similar to Creek are Immigrants from Honduras (64.2%, a difference of 0.010%), Immigrants from Trinidad and Tobago (64.2%, a difference of 0.010%), Ukrainian (64.2%, a difference of 0.010%), Puerto Rican (64.2%, a difference of 0.010%), and Immigrants from Ukraine (64.2%, a difference of 0.060%).
| Demographics | Rating | Rank | Family Households |
| Vietnamese | 43.6 /100 | #176 | Average 64.2% |
| Immigrants | Micronesia | 42.3 /100 | #177 | Average 64.2% |
| Jamaicans | 40.6 /100 | #178 | Average 64.2% |
| Immigrants | Ukraine | 38.2 /100 | #179 | Fair 64.2% |
| Immigrants | Honduras | 35.0 /100 | #180 | Fair 64.2% |
| Immigrants | Trinidad and Tobago | 34.9 /100 | #181 | Fair 64.2% |
| Ukrainians | 34.6 /100 | #182 | Fair 64.2% |
| Creek | 34.1 /100 | #183 | Fair 64.2% |
| Puerto Ricans | 33.4 /100 | #184 | Fair 64.2% |
| Immigrants | Iran | 30.4 /100 | #185 | Fair 64.1% |
| Spanish Americans | 30.1 /100 | #186 | Fair 64.1% |
| Northern Europeans | 28.2 /100 | #187 | Fair 64.1% |
| Paraguayans | 26.7 /100 | #188 | Fair 64.1% |
| Immigrants | Western Asia | 25.3 /100 | #189 | Fair 64.1% |
| Zimbabweans | 24.7 /100 | #190 | Fair 64.1% |
Demographics Similar to Immigrants from Guyana by Family Households
In terms of family households, the demographic groups most similar to Immigrants from Guyana are Immigrants from Lebanon (65.5%, a difference of 0.010%), American (65.5%, a difference of 0.020%), Jordanian (65.5%, a difference of 0.040%), Puget Sound Salish (65.6%, a difference of 0.13%), and Immigrants from Cambodia (65.4%, a difference of 0.13%).
| Demographics | Rating | Rank | Family Households |
| Immigrants | Azores | 99.8 /100 | #76 | Exceptional 65.6% |
| Immigrants | South America | 99.8 /100 | #77 | Exceptional 65.6% |
| Yaqui | 99.8 /100 | #78 | Exceptional 65.6% |
| Immigrants | Costa Rica | 99.8 /100 | #79 | Exceptional 65.6% |
| Puget Sound Salish | 99.8 /100 | #80 | Exceptional 65.6% |
| Jordanians | 99.7 /100 | #81 | Exceptional 65.5% |
| Immigrants | Lebanon | 99.7 /100 | #82 | Exceptional 65.5% |
| Immigrants | Guyana | 99.6 /100 | #83 | Exceptional 65.5% |
| Americans | 99.6 /100 | #84 | Exceptional 65.5% |
| Immigrants | Cambodia | 99.5 /100 | #85 | Exceptional 65.4% |
| Egyptians | 99.4 /100 | #86 | Exceptional 65.4% |
| Immigrants | Egypt | 99.2 /100 | #87 | Exceptional 65.3% |
| Immigrants | Haiti | 99.1 /100 | #88 | Exceptional 65.3% |
| Immigrants | Caribbean | 99.1 /100 | #89 | Exceptional 65.3% |
| Immigrants | Laos | 99.1 /100 | #90 | Exceptional 65.3% |