Creek vs Cuban Family Households
COMPARE
Creek
Cuban
Family Households
Family Households Comparison
Creek
Cubans
64.2%
FAMILY HOUSEHOLDS
34.1/ 100
METRIC RATING
183rd/ 347
METRIC RANK
67.7%
FAMILY HOUSEHOLDS
100.0/ 100
METRIC RATING
21st/ 347
METRIC RANK
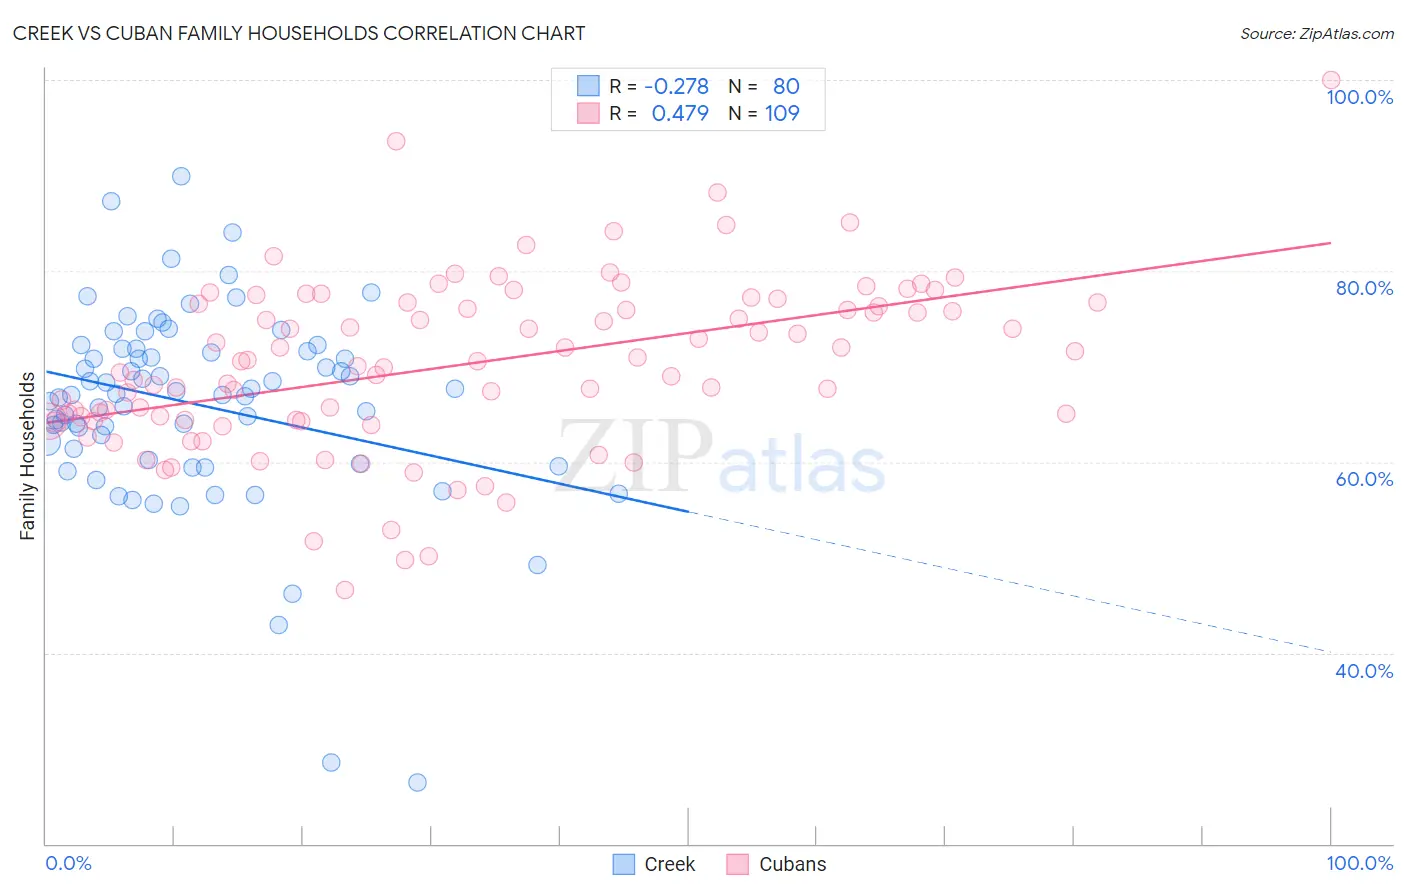
Creek vs Cuban Family Households Correlation Chart
The statistical analysis conducted on geographies consisting of 178,433,480 people shows a weak negative correlation between the proportion of Creek and percentage of family households in the United States with a correlation coefficient (R) of -0.278 and weighted average of 64.2%. Similarly, the statistical analysis conducted on geographies consisting of 448,974,040 people shows a moderate positive correlation between the proportion of Cubans and percentage of family households in the United States with a correlation coefficient (R) of 0.479 and weighted average of 67.7%, a difference of 5.6%.
Family Households Correlation Summary
| Measurement | Creek | Cuban |
| Minimum | 26.4% | 46.6% |
| Maximum | 89.9% | 100.0% |
| Range | 63.5% | 53.4% |
| Mean | 66.0% | 70.2% |
| Median | 67.1% | 70.5% |
| Interquartile 25% (IQ1) | 60.8% | 64.3% |
| Interquartile 75% (IQ3) | 71.7% | 76.6% |
| Interquartile Range (IQR) | 10.9% | 12.3% |
| Standard Deviation (Sample) | 10.4% | 9.0% |
| Standard Deviation (Population) | 10.3% | 9.0% |
Similar Demographics by Family Households
Demographics Similar to Creek by Family Households
In terms of family households, the demographic groups most similar to Creek are Immigrants from Honduras (64.2%, a difference of 0.010%), Immigrants from Trinidad and Tobago (64.2%, a difference of 0.010%), Ukrainian (64.2%, a difference of 0.010%), Puerto Rican (64.2%, a difference of 0.010%), and Immigrants from Ukraine (64.2%, a difference of 0.060%).
| Demographics | Rating | Rank | Family Households |
| Vietnamese | 43.6 /100 | #176 | Average 64.2% |
| Immigrants | Micronesia | 42.3 /100 | #177 | Average 64.2% |
| Jamaicans | 40.6 /100 | #178 | Average 64.2% |
| Immigrants | Ukraine | 38.2 /100 | #179 | Fair 64.2% |
| Immigrants | Honduras | 35.0 /100 | #180 | Fair 64.2% |
| Immigrants | Trinidad and Tobago | 34.9 /100 | #181 | Fair 64.2% |
| Ukrainians | 34.6 /100 | #182 | Fair 64.2% |
| Creek | 34.1 /100 | #183 | Fair 64.2% |
| Puerto Ricans | 33.4 /100 | #184 | Fair 64.2% |
| Immigrants | Iran | 30.4 /100 | #185 | Fair 64.1% |
| Spanish Americans | 30.1 /100 | #186 | Fair 64.1% |
| Northern Europeans | 28.2 /100 | #187 | Fair 64.1% |
| Paraguayans | 26.7 /100 | #188 | Fair 64.1% |
| Immigrants | Western Asia | 25.3 /100 | #189 | Fair 64.1% |
| Zimbabweans | 24.7 /100 | #190 | Fair 64.1% |
Demographics Similar to Cubans by Family Households
In terms of family households, the demographic groups most similar to Cubans are Sri Lankan (67.7%, a difference of 0.040%), Inupiat (67.8%, a difference of 0.050%), Immigrants from Pakistan (67.7%, a difference of 0.12%), Samoan (67.9%, a difference of 0.30%), and Immigrants from South Eastern Asia (67.5%, a difference of 0.41%).
| Demographics | Rating | Rank | Family Households |
| Immigrants | Cuba | 100.0 /100 | #14 | Exceptional 68.2% |
| Assyrians/Chaldeans/Syriacs | 100.0 /100 | #15 | Exceptional 68.2% |
| Immigrants | Vietnam | 100.0 /100 | #16 | Exceptional 68.2% |
| Chinese | 100.0 /100 | #17 | Exceptional 68.1% |
| Immigrants | Taiwan | 100.0 /100 | #18 | Exceptional 68.0% |
| Samoans | 100.0 /100 | #19 | Exceptional 67.9% |
| Inupiat | 100.0 /100 | #20 | Exceptional 67.8% |
| Cubans | 100.0 /100 | #21 | Exceptional 67.7% |
| Sri Lankans | 100.0 /100 | #22 | Exceptional 67.7% |
| Immigrants | Pakistan | 100.0 /100 | #23 | Exceptional 67.7% |
| Immigrants | South Eastern Asia | 100.0 /100 | #24 | Exceptional 67.5% |
| Immigrants | Nicaragua | 100.0 /100 | #25 | Exceptional 67.5% |
| Immigrants | India | 100.0 /100 | #26 | Exceptional 67.4% |
| Hispanics or Latinos | 100.0 /100 | #27 | Exceptional 67.4% |
| Hawaiians | 100.0 /100 | #28 | Exceptional 67.4% |