Creek vs Immigrants from Korea Family Households
COMPARE
Creek
Immigrants from Korea
Family Households
Family Households Comparison
Creek
Immigrants from Korea
64.2%
FAMILY HOUSEHOLDS
34.1/ 100
METRIC RATING
183rd/ 347
METRIC RANK
66.0%
FAMILY HOUSEHOLDS
100.0/ 100
METRIC RATING
59th/ 347
METRIC RANK
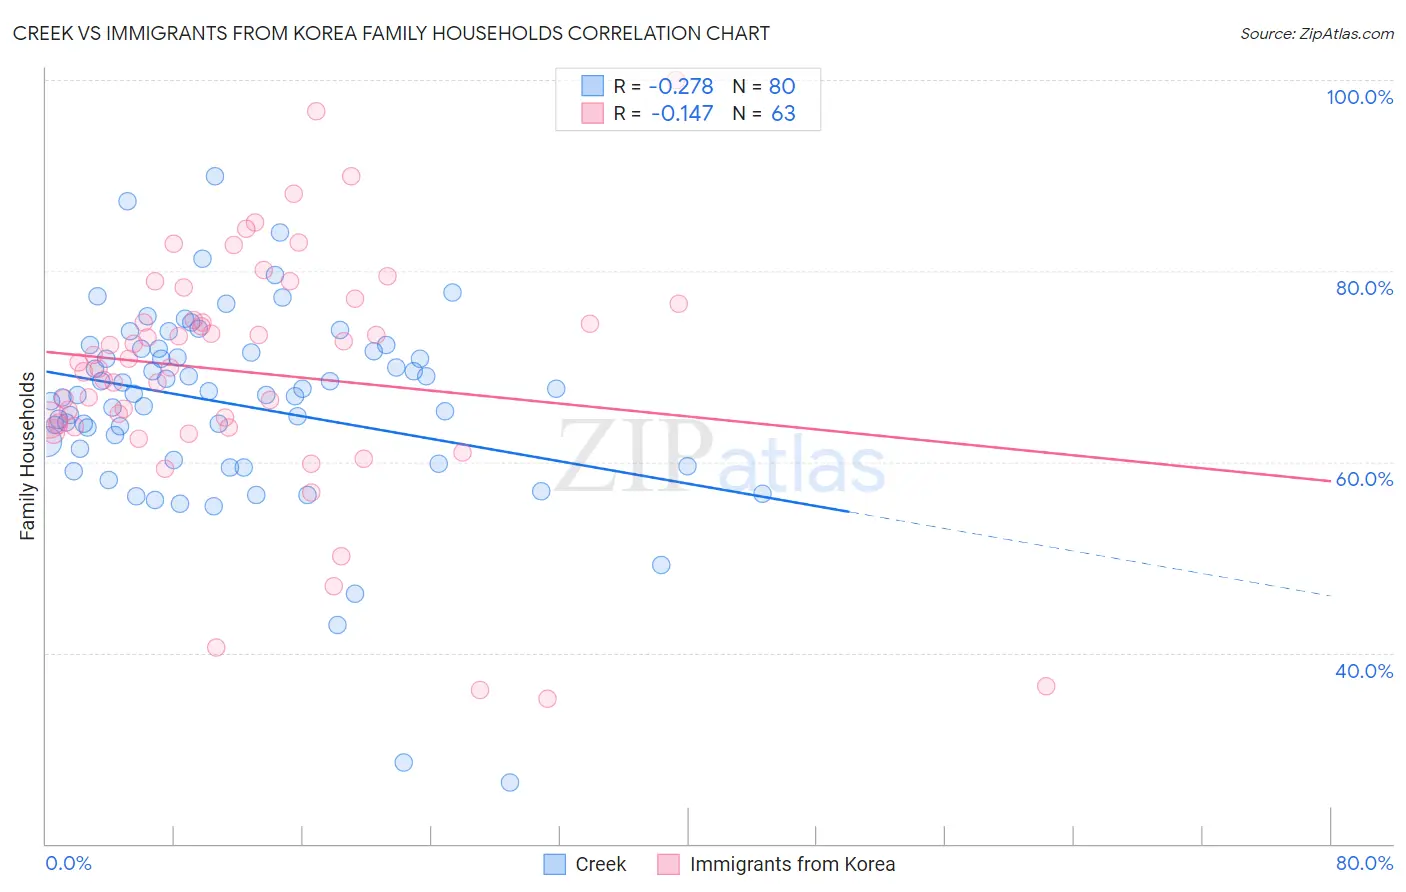
Creek vs Immigrants from Korea Family Households Correlation Chart
The statistical analysis conducted on geographies consisting of 178,433,480 people shows a weak negative correlation between the proportion of Creek and percentage of family households in the United States with a correlation coefficient (R) of -0.278 and weighted average of 64.2%. Similarly, the statistical analysis conducted on geographies consisting of 415,966,940 people shows a poor negative correlation between the proportion of Immigrants from Korea and percentage of family households in the United States with a correlation coefficient (R) of -0.147 and weighted average of 66.0%, a difference of 2.9%.
Family Households Correlation Summary
| Measurement | Creek | Immigrants from Korea |
| Minimum | 26.4% | 35.2% |
| Maximum | 89.9% | 100.0% |
| Range | 63.5% | 64.8% |
| Mean | 66.0% | 69.4% |
| Median | 67.1% | 70.4% |
| Interquartile 25% (IQ1) | 60.8% | 63.7% |
| Interquartile 75% (IQ3) | 71.7% | 76.6% |
| Interquartile Range (IQR) | 10.9% | 12.9% |
| Standard Deviation (Sample) | 10.4% | 12.8% |
| Standard Deviation (Population) | 10.3% | 12.7% |
Similar Demographics by Family Households
Demographics Similar to Creek by Family Households
In terms of family households, the demographic groups most similar to Creek are Immigrants from Honduras (64.2%, a difference of 0.010%), Immigrants from Trinidad and Tobago (64.2%, a difference of 0.010%), Ukrainian (64.2%, a difference of 0.010%), Puerto Rican (64.2%, a difference of 0.010%), and Immigrants from Ukraine (64.2%, a difference of 0.060%).
| Demographics | Rating | Rank | Family Households |
| Vietnamese | 43.6 /100 | #176 | Average 64.2% |
| Immigrants | Micronesia | 42.3 /100 | #177 | Average 64.2% |
| Jamaicans | 40.6 /100 | #178 | Average 64.2% |
| Immigrants | Ukraine | 38.2 /100 | #179 | Fair 64.2% |
| Immigrants | Honduras | 35.0 /100 | #180 | Fair 64.2% |
| Immigrants | Trinidad and Tobago | 34.9 /100 | #181 | Fair 64.2% |
| Ukrainians | 34.6 /100 | #182 | Fair 64.2% |
| Creek | 34.1 /100 | #183 | Fair 64.2% |
| Puerto Ricans | 33.4 /100 | #184 | Fair 64.2% |
| Immigrants | Iran | 30.4 /100 | #185 | Fair 64.1% |
| Spanish Americans | 30.1 /100 | #186 | Fair 64.1% |
| Northern Europeans | 28.2 /100 | #187 | Fair 64.1% |
| Paraguayans | 26.7 /100 | #188 | Fair 64.1% |
| Immigrants | Western Asia | 25.3 /100 | #189 | Fair 64.1% |
| Zimbabweans | 24.7 /100 | #190 | Fair 64.1% |
Demographics Similar to Immigrants from Korea by Family Households
In terms of family households, the demographic groups most similar to Immigrants from Korea are South American (66.0%, a difference of 0.010%), Immigrants from Asia (66.1%, a difference of 0.020%), Danish (66.0%, a difference of 0.030%), Central American (66.0%, a difference of 0.060%), and Immigrants from Indonesia (66.0%, a difference of 0.10%).
| Demographics | Rating | Rank | Family Households |
| Colombians | 100.0 /100 | #52 | Exceptional 66.3% |
| Afghans | 100.0 /100 | #53 | Exceptional 66.3% |
| Immigrants | Colombia | 100.0 /100 | #54 | Exceptional 66.3% |
| Immigrants | Immigrants | 100.0 /100 | #55 | Exceptional 66.1% |
| Immigrants | Hong Kong | 100.0 /100 | #56 | Exceptional 66.1% |
| Pennsylvania Germans | 100.0 /100 | #57 | Exceptional 66.1% |
| Immigrants | Asia | 100.0 /100 | #58 | Exceptional 66.1% |
| Immigrants | Korea | 100.0 /100 | #59 | Exceptional 66.0% |
| South Americans | 100.0 /100 | #60 | Exceptional 66.0% |
| Danes | 100.0 /100 | #61 | Exceptional 66.0% |
| Central Americans | 100.0 /100 | #62 | Exceptional 66.0% |
| Immigrants | Indonesia | 100.0 /100 | #63 | Exceptional 66.0% |
| Pima | 99.9 /100 | #64 | Exceptional 65.9% |
| Costa Ricans | 99.9 /100 | #65 | Exceptional 65.9% |
| Fijians | 99.9 /100 | #66 | Exceptional 65.9% |