Immigrants from Ghana vs Thai Family Households
COMPARE
Immigrants from Ghana
Thai
Family Households
Family Households Comparison
Immigrants from Ghana
Thais
63.4%
FAMILY HOUSEHOLDS
1.6/ 100
METRIC RATING
246th/ 347
METRIC RANK
67.2%
FAMILY HOUSEHOLDS
100.0/ 100
METRIC RATING
34th/ 347
METRIC RANK
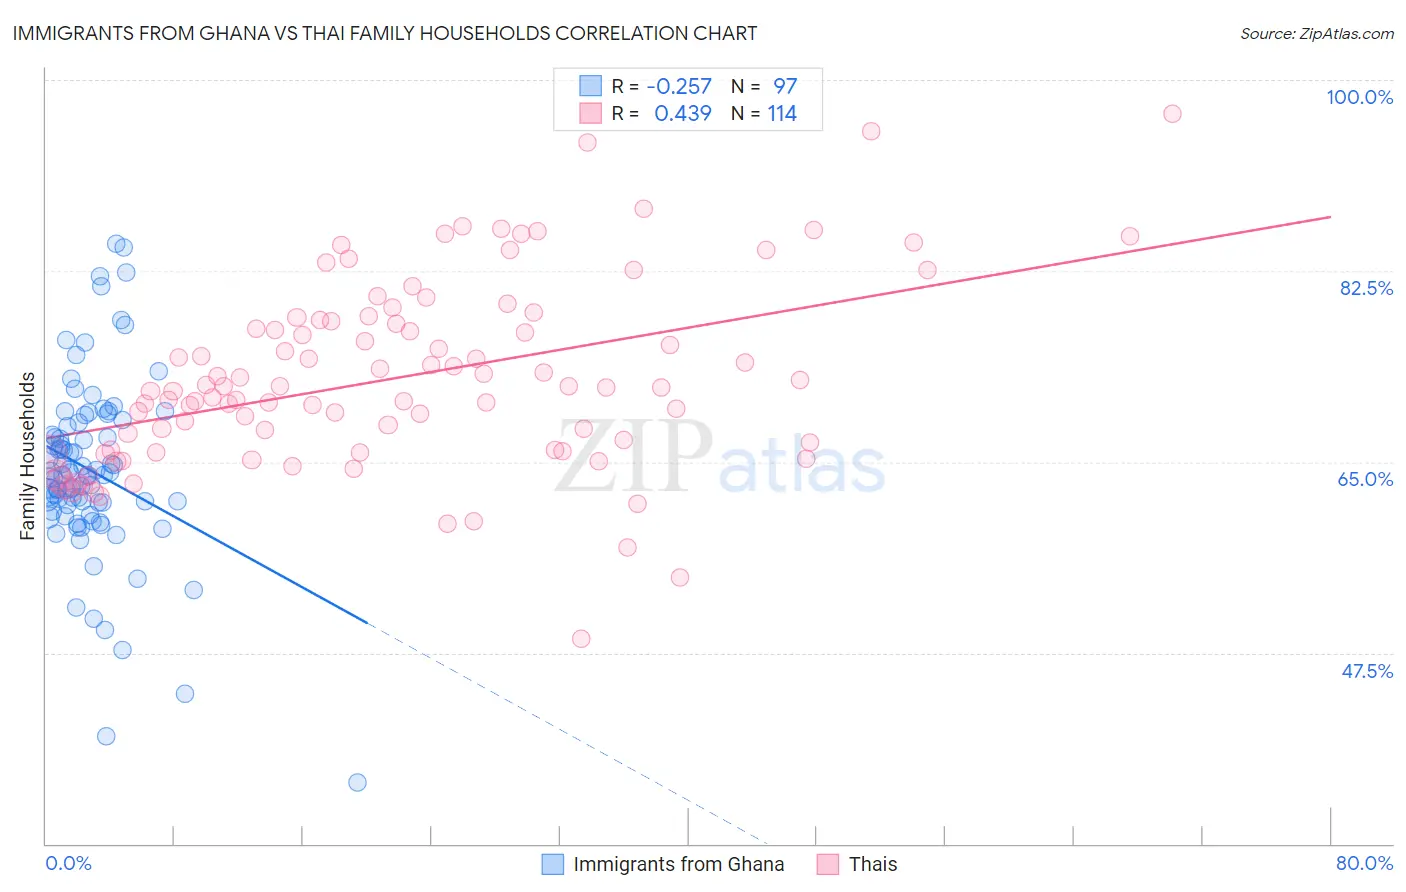
Immigrants from Ghana vs Thai Family Households Correlation Chart
The statistical analysis conducted on geographies consisting of 199,806,163 people shows a weak negative correlation between the proportion of Immigrants from Ghana and percentage of family households in the United States with a correlation coefficient (R) of -0.257 and weighted average of 63.4%. Similarly, the statistical analysis conducted on geographies consisting of 475,372,793 people shows a moderate positive correlation between the proportion of Thais and percentage of family households in the United States with a correlation coefficient (R) of 0.439 and weighted average of 67.2%, a difference of 5.9%.
Family Households Correlation Summary
| Measurement | Immigrants from Ghana | Thai |
| Minimum | 35.6% | 48.8% |
| Maximum | 85.0% | 97.0% |
| Range | 49.4% | 48.2% |
| Mean | 64.2% | 72.7% |
| Median | 63.8% | 71.8% |
| Interquartile 25% (IQ1) | 60.8% | 66.1% |
| Interquartile 75% (IQ3) | 68.4% | 77.9% |
| Interquartile Range (IQR) | 7.6% | 11.8% |
| Standard Deviation (Sample) | 8.3% | 8.6% |
| Standard Deviation (Population) | 8.2% | 8.5% |
Similar Demographics by Family Households
Demographics Similar to Immigrants from Ghana by Family Households
In terms of family households, the demographic groups most similar to Immigrants from Ghana are Immigrants from Uzbekistan (63.4%, a difference of 0.010%), Eastern European (63.4%, a difference of 0.020%), Immigrants from Dominica (63.4%, a difference of 0.020%), Dominican (63.4%, a difference of 0.020%), and Russian (63.4%, a difference of 0.030%).
| Demographics | Rating | Rank | Family Households |
| Aleuts | 1.9 /100 | #239 | Tragic 63.4% |
| South Africans | 1.9 /100 | #240 | Tragic 63.4% |
| Immigrants | St. Vincent and the Grenadines | 1.9 /100 | #241 | Tragic 63.4% |
| Immigrants | Israel | 1.8 /100 | #242 | Tragic 63.4% |
| Immigrants | Czechoslovakia | 1.8 /100 | #243 | Tragic 63.4% |
| Eastern Europeans | 1.6 /100 | #244 | Tragic 63.4% |
| Immigrants | Dominica | 1.6 /100 | #245 | Tragic 63.4% |
| Immigrants | Ghana | 1.6 /100 | #246 | Tragic 63.4% |
| Immigrants | Uzbekistan | 1.5 /100 | #247 | Tragic 63.4% |
| Dominicans | 1.5 /100 | #248 | Tragic 63.4% |
| Russians | 1.4 /100 | #249 | Tragic 63.4% |
| Immigrants | Japan | 1.4 /100 | #250 | Tragic 63.4% |
| Taiwanese | 1.2 /100 | #251 | Tragic 63.3% |
| Bahamians | 1.1 /100 | #252 | Tragic 63.3% |
| Immigrants | Dominican Republic | 1.0 /100 | #253 | Tragic 63.3% |
Demographics Similar to Thais by Family Households
In terms of family households, the demographic groups most similar to Thais are Salvadoran (67.2%, a difference of 0.0%), Nepalese (67.2%, a difference of 0.040%), Tohono O'odham (67.1%, a difference of 0.050%), Peruvian (67.1%, a difference of 0.060%), and Immigrants from Latin America (67.2%, a difference of 0.10%).
| Demographics | Rating | Rank | Family Households |
| Hispanics or Latinos | 100.0 /100 | #27 | Exceptional 67.4% |
| Hawaiians | 100.0 /100 | #28 | Exceptional 67.4% |
| Nicaraguans | 100.0 /100 | #29 | Exceptional 67.4% |
| Immigrants | Peru | 100.0 /100 | #30 | Exceptional 67.2% |
| Immigrants | Latin America | 100.0 /100 | #31 | Exceptional 67.2% |
| Nepalese | 100.0 /100 | #32 | Exceptional 67.2% |
| Salvadorans | 100.0 /100 | #33 | Exceptional 67.2% |
| Thais | 100.0 /100 | #34 | Exceptional 67.2% |
| Tohono O'odham | 100.0 /100 | #35 | Exceptional 67.1% |
| Peruvians | 100.0 /100 | #36 | Exceptional 67.1% |
| Tsimshian | 100.0 /100 | #37 | Exceptional 67.1% |
| Mexican American Indians | 100.0 /100 | #38 | Exceptional 67.0% |
| Immigrants | El Salvador | 100.0 /100 | #39 | Exceptional 67.0% |
| Guamanians/Chamorros | 100.0 /100 | #40 | Exceptional 66.6% |
| Immigrants | Bolivia | 100.0 /100 | #41 | Exceptional 66.6% |