Immigrants from Syria vs Thai Family Households
COMPARE
Immigrants from Syria
Thai
Family Households
Family Households Comparison
Immigrants from Syria
Thais
65.2%
FAMILY HOUSEHOLDS
98.4/ 100
METRIC RATING
98th/ 347
METRIC RANK
67.2%
FAMILY HOUSEHOLDS
100.0/ 100
METRIC RATING
34th/ 347
METRIC RANK
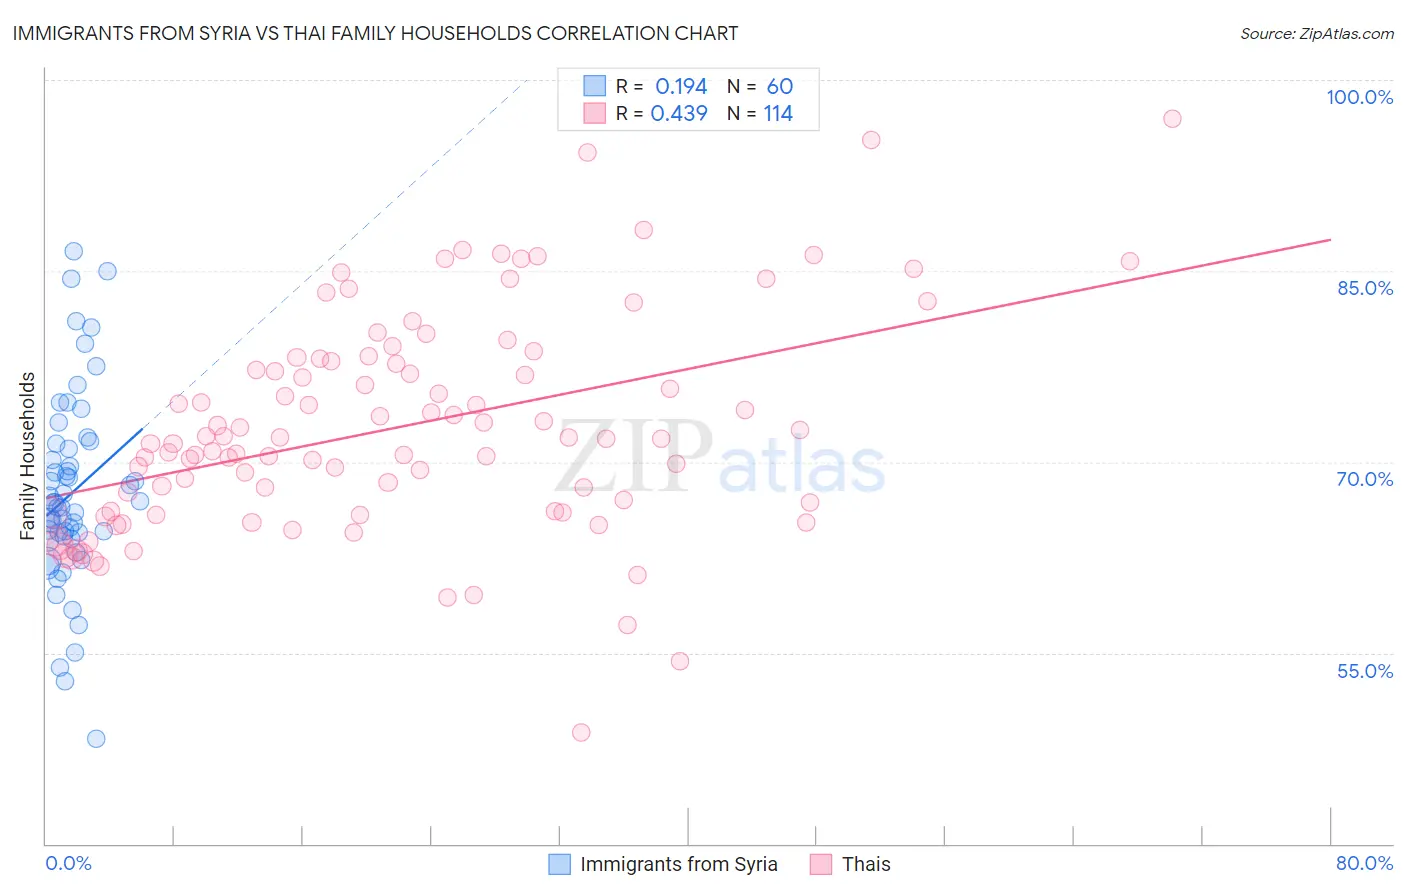
Immigrants from Syria vs Thai Family Households Correlation Chart
The statistical analysis conducted on geographies consisting of 174,105,874 people shows a poor positive correlation between the proportion of Immigrants from Syria and percentage of family households in the United States with a correlation coefficient (R) of 0.194 and weighted average of 65.2%. Similarly, the statistical analysis conducted on geographies consisting of 475,372,793 people shows a moderate positive correlation between the proportion of Thais and percentage of family households in the United States with a correlation coefficient (R) of 0.439 and weighted average of 67.2%, a difference of 3.0%.
Family Households Correlation Summary
| Measurement | Immigrants from Syria | Thai |
| Minimum | 48.3% | 48.8% |
| Maximum | 86.5% | 97.0% |
| Range | 38.3% | 48.2% |
| Mean | 67.5% | 72.7% |
| Median | 66.6% | 71.8% |
| Interquartile 25% (IQ1) | 64.0% | 66.1% |
| Interquartile 75% (IQ3) | 71.2% | 77.9% |
| Interquartile Range (IQR) | 7.2% | 11.8% |
| Standard Deviation (Sample) | 7.6% | 8.6% |
| Standard Deviation (Population) | 7.5% | 8.5% |
Similar Demographics by Family Households
Demographics Similar to Immigrants from Syria by Family Households
In terms of family households, the demographic groups most similar to Immigrants from Syria are Central American Indian (65.2%, a difference of 0.020%), Swiss (65.2%, a difference of 0.040%), Guatemalan (65.2%, a difference of 0.040%), Immigrants from Portugal (65.2%, a difference of 0.050%), and Haitian (65.2%, a difference of 0.060%).
| Demographics | Rating | Rank | Family Households |
| Crow | 98.9 /100 | #91 | Exceptional 65.3% |
| Hopi | 98.8 /100 | #92 | Exceptional 65.3% |
| Guyanese | 98.8 /100 | #93 | Exceptional 65.3% |
| Immigrants | Poland | 98.7 /100 | #94 | Exceptional 65.2% |
| Immigrants | Portugal | 98.6 /100 | #95 | Exceptional 65.2% |
| Swiss | 98.6 /100 | #96 | Exceptional 65.2% |
| Guatemalans | 98.6 /100 | #97 | Exceptional 65.2% |
| Immigrants | Syria | 98.4 /100 | #98 | Exceptional 65.2% |
| Central American Indians | 98.3 /100 | #99 | Exceptional 65.2% |
| Haitians | 98.1 /100 | #100 | Exceptional 65.2% |
| Chileans | 98.1 /100 | #101 | Exceptional 65.2% |
| Immigrants | Sri Lanka | 98.0 /100 | #102 | Exceptional 65.1% |
| Indians (Asian) | 97.9 /100 | #103 | Exceptional 65.1% |
| Spaniards | 97.8 /100 | #104 | Exceptional 65.1% |
| English | 97.4 /100 | #105 | Exceptional 65.1% |
Demographics Similar to Thais by Family Households
In terms of family households, the demographic groups most similar to Thais are Salvadoran (67.2%, a difference of 0.0%), Nepalese (67.2%, a difference of 0.040%), Tohono O'odham (67.1%, a difference of 0.050%), Peruvian (67.1%, a difference of 0.060%), and Immigrants from Latin America (67.2%, a difference of 0.10%).
| Demographics | Rating | Rank | Family Households |
| Hispanics or Latinos | 100.0 /100 | #27 | Exceptional 67.4% |
| Hawaiians | 100.0 /100 | #28 | Exceptional 67.4% |
| Nicaraguans | 100.0 /100 | #29 | Exceptional 67.4% |
| Immigrants | Peru | 100.0 /100 | #30 | Exceptional 67.2% |
| Immigrants | Latin America | 100.0 /100 | #31 | Exceptional 67.2% |
| Nepalese | 100.0 /100 | #32 | Exceptional 67.2% |
| Salvadorans | 100.0 /100 | #33 | Exceptional 67.2% |
| Thais | 100.0 /100 | #34 | Exceptional 67.2% |
| Tohono O'odham | 100.0 /100 | #35 | Exceptional 67.1% |
| Peruvians | 100.0 /100 | #36 | Exceptional 67.1% |
| Tsimshian | 100.0 /100 | #37 | Exceptional 67.1% |
| Mexican American Indians | 100.0 /100 | #38 | Exceptional 67.0% |
| Immigrants | El Salvador | 100.0 /100 | #39 | Exceptional 67.0% |
| Guamanians/Chamorros | 100.0 /100 | #40 | Exceptional 66.6% |
| Immigrants | Bolivia | 100.0 /100 | #41 | Exceptional 66.6% |