Cree vs Kenyan Family Households
COMPARE
Cree
Kenyan
Family Households
Family Households Comparison
Cree
Kenyans
62.3%
FAMILY HOUSEHOLDS
0.0/ 100
METRIC RATING
303rd/ 347
METRIC RANK
63.2%
FAMILY HOUSEHOLDS
0.5/ 100
METRIC RATING
264th/ 347
METRIC RANK
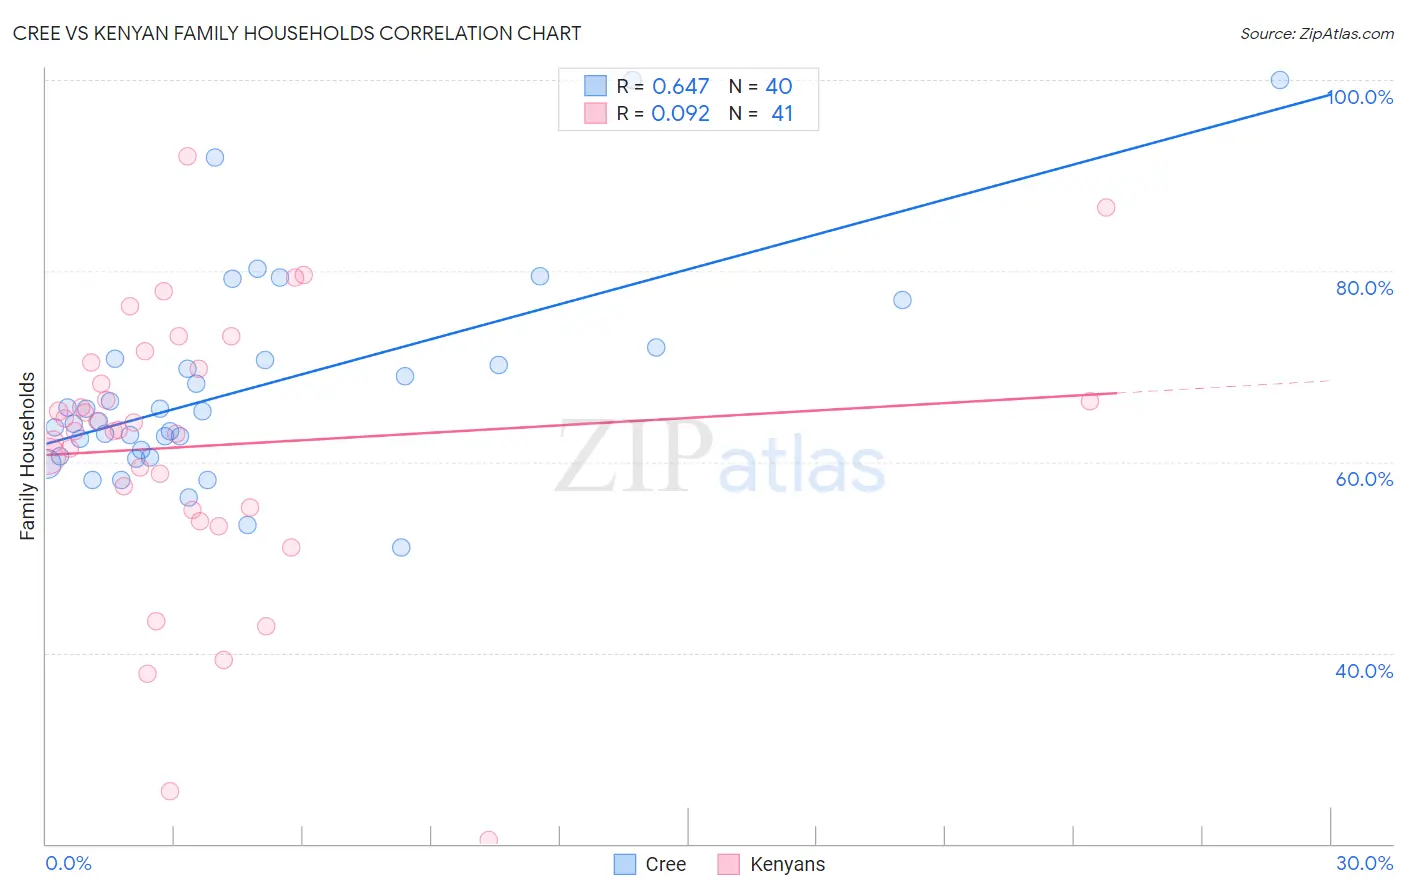
Cree vs Kenyan Family Households Correlation Chart
The statistical analysis conducted on geographies consisting of 76,210,457 people shows a significant positive correlation between the proportion of Cree and percentage of family households in the United States with a correlation coefficient (R) of 0.647 and weighted average of 62.3%. Similarly, the statistical analysis conducted on geographies consisting of 168,172,574 people shows a slight positive correlation between the proportion of Kenyans and percentage of family households in the United States with a correlation coefficient (R) of 0.092 and weighted average of 63.2%, a difference of 1.4%.
Family Households Correlation Summary
| Measurement | Cree | Kenyan |
| Minimum | 51.1% | 20.4% |
| Maximum | 100.0% | 92.0% |
| Range | 48.9% | 71.6% |
| Mean | 67.8% | 61.7% |
| Median | 64.8% | 63.4% |
| Interquartile 25% (IQ1) | 60.9% | 55.1% |
| Interquartile 75% (IQ3) | 70.7% | 70.1% |
| Interquartile Range (IQR) | 9.9% | 14.9% |
| Standard Deviation (Sample) | 11.0% | 14.5% |
| Standard Deviation (Population) | 10.9% | 14.4% |
Similar Demographics by Family Households
Demographics Similar to Cree by Family Households
In terms of family households, the demographic groups most similar to Cree are Immigrants from Kenya (62.3%, a difference of 0.060%), Immigrants from Albania (62.4%, a difference of 0.10%), Iroquois (62.2%, a difference of 0.10%), Immigrants from Kuwait (62.4%, a difference of 0.12%), and Immigrants from Africa (62.4%, a difference of 0.12%).
| Demographics | Rating | Rank | Family Households |
| Slovenes | 0.0 /100 | #296 | Tragic 62.4% |
| French American Indians | 0.0 /100 | #297 | Tragic 62.4% |
| Immigrants | Spain | 0.0 /100 | #298 | Tragic 62.4% |
| Immigrants | Kuwait | 0.0 /100 | #299 | Tragic 62.4% |
| Immigrants | Africa | 0.0 /100 | #300 | Tragic 62.4% |
| Immigrants | Albania | 0.0 /100 | #301 | Tragic 62.4% |
| Immigrants | Kenya | 0.0 /100 | #302 | Tragic 62.3% |
| Cree | 0.0 /100 | #303 | Tragic 62.3% |
| Iroquois | 0.0 /100 | #304 | Tragic 62.2% |
| Bermudans | 0.0 /100 | #305 | Tragic 62.2% |
| Africans | 0.0 /100 | #306 | Tragic 62.1% |
| Immigrants | Norway | 0.0 /100 | #307 | Tragic 62.1% |
| Chippewa | 0.0 /100 | #308 | Tragic 62.1% |
| Sub-Saharan Africans | 0.0 /100 | #309 | Tragic 62.1% |
| Immigrants | Liberia | 0.0 /100 | #310 | Tragic 62.0% |
Demographics Similar to Kenyans by Family Households
In terms of family households, the demographic groups most similar to Kenyans are Cheyenne (63.2%, a difference of 0.010%), Colville (63.2%, a difference of 0.010%), Immigrants from Western Africa (63.1%, a difference of 0.020%), Immigrants from Ireland (63.2%, a difference of 0.030%), and Immigrants from Russia (63.2%, a difference of 0.040%).
| Demographics | Rating | Rank | Family Households |
| Icelanders | 0.8 /100 | #257 | Tragic 63.3% |
| Immigrants | Barbados | 0.7 /100 | #258 | Tragic 63.2% |
| Immigrants | Western Europe | 0.6 /100 | #259 | Tragic 63.2% |
| Cypriots | 0.6 /100 | #260 | Tragic 63.2% |
| Immigrants | Russia | 0.6 /100 | #261 | Tragic 63.2% |
| Immigrants | Ireland | 0.6 /100 | #262 | Tragic 63.2% |
| Cheyenne | 0.5 /100 | #263 | Tragic 63.2% |
| Kenyans | 0.5 /100 | #264 | Tragic 63.2% |
| Colville | 0.5 /100 | #265 | Tragic 63.2% |
| Immigrants | Western Africa | 0.5 /100 | #266 | Tragic 63.1% |
| Israelis | 0.4 /100 | #267 | Tragic 63.1% |
| Immigrants | Singapore | 0.4 /100 | #268 | Tragic 63.1% |
| Yugoslavians | 0.4 /100 | #269 | Tragic 63.1% |
| Immigrants | Austria | 0.3 /100 | #270 | Tragic 63.1% |
| Immigrants | Croatia | 0.3 /100 | #271 | Tragic 63.1% |