Cree vs Inupiat Family Households
COMPARE
Cree
Inupiat
Family Households
Family Households Comparison
Cree
Inupiat
62.3%
FAMILY HOUSEHOLDS
0.0/ 100
METRIC RATING
303rd/ 347
METRIC RANK
67.8%
FAMILY HOUSEHOLDS
100.0/ 100
METRIC RATING
20th/ 347
METRIC RANK
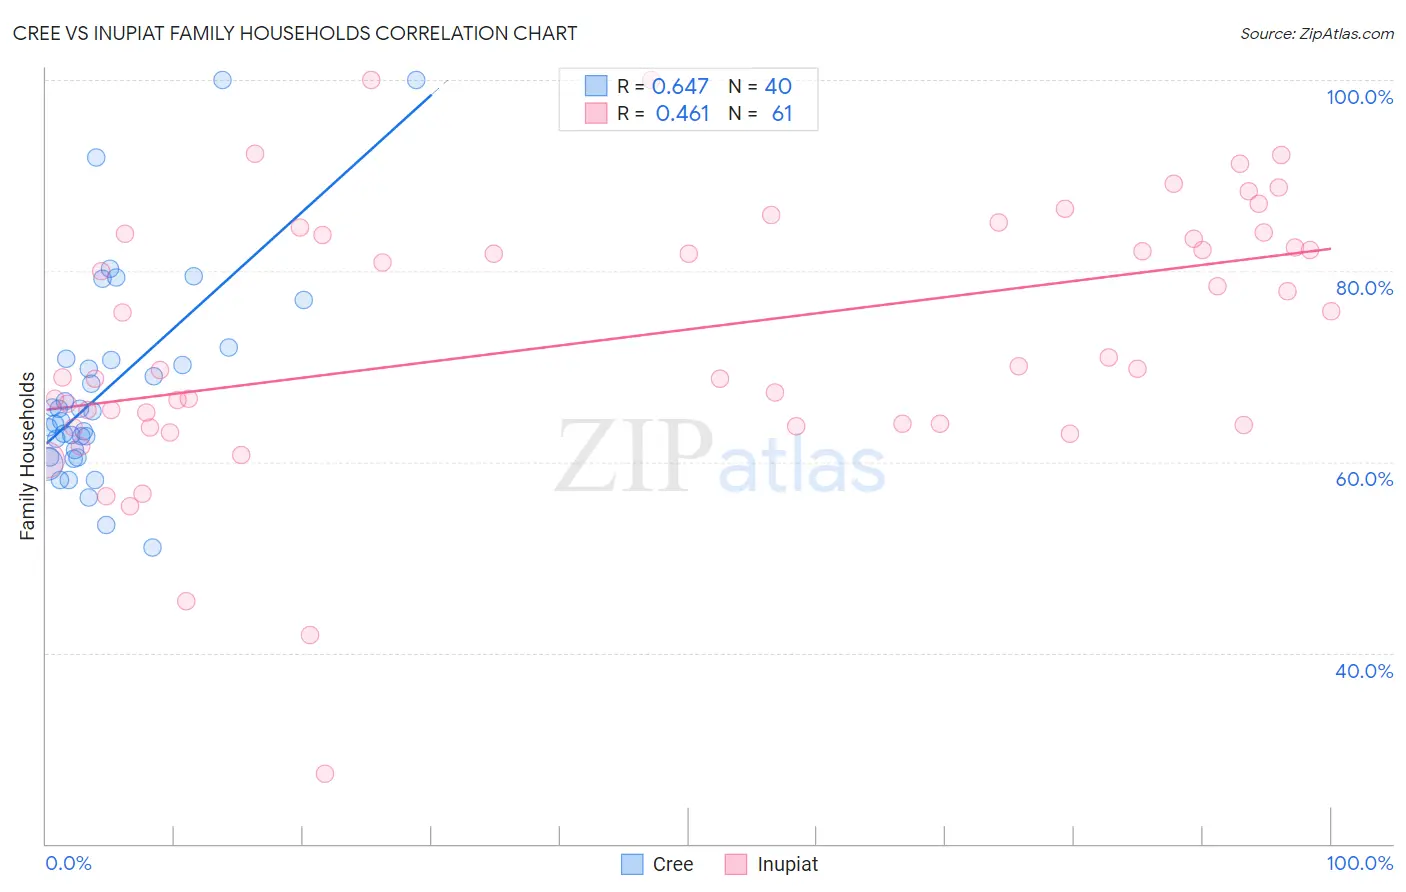
Cree vs Inupiat Family Households Correlation Chart
The statistical analysis conducted on geographies consisting of 76,210,457 people shows a significant positive correlation between the proportion of Cree and percentage of family households in the United States with a correlation coefficient (R) of 0.647 and weighted average of 62.3%. Similarly, the statistical analysis conducted on geographies consisting of 96,321,767 people shows a moderate positive correlation between the proportion of Inupiat and percentage of family households in the United States with a correlation coefficient (R) of 0.461 and weighted average of 67.8%, a difference of 8.8%.
Family Households Correlation Summary
| Measurement | Cree | Inupiat |
| Minimum | 51.1% | 27.3% |
| Maximum | 100.0% | 100.0% |
| Range | 48.9% | 72.7% |
| Mean | 67.8% | 73.1% |
| Median | 64.8% | 70.0% |
| Interquartile 25% (IQ1) | 60.9% | 63.9% |
| Interquartile 75% (IQ3) | 70.7% | 83.8% |
| Interquartile Range (IQR) | 9.9% | 19.9% |
| Standard Deviation (Sample) | 11.0% | 13.9% |
| Standard Deviation (Population) | 10.9% | 13.7% |
Similar Demographics by Family Households
Demographics Similar to Cree by Family Households
In terms of family households, the demographic groups most similar to Cree are Immigrants from Kenya (62.3%, a difference of 0.060%), Immigrants from Albania (62.4%, a difference of 0.10%), Iroquois (62.2%, a difference of 0.10%), Immigrants from Kuwait (62.4%, a difference of 0.12%), and Immigrants from Africa (62.4%, a difference of 0.12%).
| Demographics | Rating | Rank | Family Households |
| Slovenes | 0.0 /100 | #296 | Tragic 62.4% |
| French American Indians | 0.0 /100 | #297 | Tragic 62.4% |
| Immigrants | Spain | 0.0 /100 | #298 | Tragic 62.4% |
| Immigrants | Kuwait | 0.0 /100 | #299 | Tragic 62.4% |
| Immigrants | Africa | 0.0 /100 | #300 | Tragic 62.4% |
| Immigrants | Albania | 0.0 /100 | #301 | Tragic 62.4% |
| Immigrants | Kenya | 0.0 /100 | #302 | Tragic 62.3% |
| Cree | 0.0 /100 | #303 | Tragic 62.3% |
| Iroquois | 0.0 /100 | #304 | Tragic 62.2% |
| Bermudans | 0.0 /100 | #305 | Tragic 62.2% |
| Africans | 0.0 /100 | #306 | Tragic 62.1% |
| Immigrants | Norway | 0.0 /100 | #307 | Tragic 62.1% |
| Chippewa | 0.0 /100 | #308 | Tragic 62.1% |
| Sub-Saharan Africans | 0.0 /100 | #309 | Tragic 62.1% |
| Immigrants | Liberia | 0.0 /100 | #310 | Tragic 62.0% |
Demographics Similar to Inupiat by Family Households
In terms of family households, the demographic groups most similar to Inupiat are Cuban (67.7%, a difference of 0.050%), Sri Lankan (67.7%, a difference of 0.090%), Immigrants from Pakistan (67.7%, a difference of 0.17%), Samoan (67.9%, a difference of 0.25%), and Immigrants from Taiwan (68.0%, a difference of 0.37%).
| Demographics | Rating | Rank | Family Households |
| Pueblo | 100.0 /100 | #13 | Exceptional 68.2% |
| Immigrants | Cuba | 100.0 /100 | #14 | Exceptional 68.2% |
| Assyrians/Chaldeans/Syriacs | 100.0 /100 | #15 | Exceptional 68.2% |
| Immigrants | Vietnam | 100.0 /100 | #16 | Exceptional 68.2% |
| Chinese | 100.0 /100 | #17 | Exceptional 68.1% |
| Immigrants | Taiwan | 100.0 /100 | #18 | Exceptional 68.0% |
| Samoans | 100.0 /100 | #19 | Exceptional 67.9% |
| Inupiat | 100.0 /100 | #20 | Exceptional 67.8% |
| Cubans | 100.0 /100 | #21 | Exceptional 67.7% |
| Sri Lankans | 100.0 /100 | #22 | Exceptional 67.7% |
| Immigrants | Pakistan | 100.0 /100 | #23 | Exceptional 67.7% |
| Immigrants | South Eastern Asia | 100.0 /100 | #24 | Exceptional 67.5% |
| Immigrants | Nicaragua | 100.0 /100 | #25 | Exceptional 67.5% |
| Immigrants | India | 100.0 /100 | #26 | Exceptional 67.4% |
| Hispanics or Latinos | 100.0 /100 | #27 | Exceptional 67.4% |