Houma vs Costa Rican Average Family Size
COMPARE
Houma
Costa Rican
Average Family Size
Average Family Size Comparison
Houma
Costa Ricans
3.18
AVERAGE FAMILY SIZE
3.4/ 100
METRIC RATING
239th/ 347
METRIC RANK
3.26
AVERAGE FAMILY SIZE
86.8/ 100
METRIC RATING
132nd/ 347
METRIC RANK
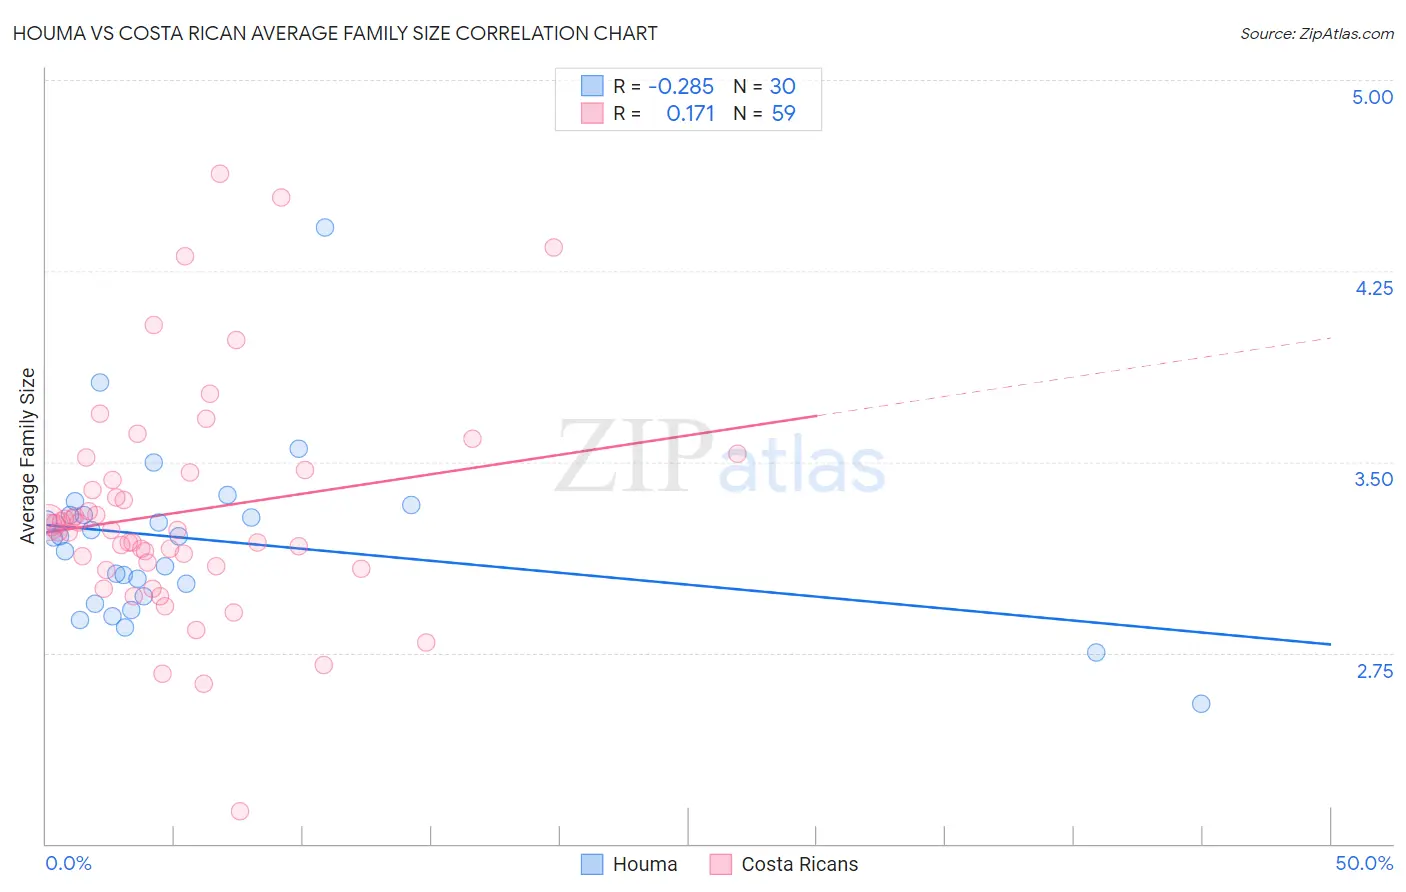
Houma vs Costa Rican Average Family Size Correlation Chart
The statistical analysis conducted on geographies consisting of 36,793,313 people shows a weak negative correlation between the proportion of Houma and average family size in the United States with a correlation coefficient (R) of -0.285 and weighted average of 3.18. Similarly, the statistical analysis conducted on geographies consisting of 253,470,463 people shows a poor positive correlation between the proportion of Costa Ricans and average family size in the United States with a correlation coefficient (R) of 0.171 and weighted average of 3.26, a difference of 2.4%.
Average Family Size Correlation Summary
| Measurement | Houma | Costa Rican |
| Minimum | 2.55 | 2.13 |
| Maximum | 4.42 | 4.63 |
| Range | 1.87 | 2.50 |
| Mean | 3.19 | 3.30 |
| Median | 3.20 | 3.23 |
| Interquartile 25% (IQ1) | 2.97 | 3.09 |
| Interquartile 75% (IQ3) | 3.29 | 3.46 |
| Interquartile Range (IQR) | 0.32 | 0.37 |
| Standard Deviation (Sample) | 0.34 | 0.44 |
| Standard Deviation (Population) | 0.34 | 0.44 |
Similar Demographics by Average Family Size
Demographics Similar to Houma by Average Family Size
In terms of average family size, the demographic groups most similar to Houma are Osage (3.18, a difference of 0.020%), Immigrants from Romania (3.18, a difference of 0.050%), Romanian (3.18, a difference of 0.050%), Immigrants from Japan (3.18, a difference of 0.050%), and Hungarian (3.18, a difference of 0.060%).
| Demographics | Rating | Rank | Average Family Size |
| Cherokee | 4.7 /100 | #232 | Tragic 3.18 |
| Brazilians | 4.5 /100 | #233 | Tragic 3.18 |
| Iranians | 4.5 /100 | #234 | Tragic 3.18 |
| Immigrants | Turkey | 4.2 /100 | #235 | Tragic 3.18 |
| Immigrants | Portugal | 4.2 /100 | #236 | Tragic 3.18 |
| Immigrants | Romania | 3.7 /100 | #237 | Tragic 3.18 |
| Romanians | 3.7 /100 | #238 | Tragic 3.18 |
| Houma | 3.4 /100 | #239 | Tragic 3.18 |
| Osage | 3.2 /100 | #240 | Tragic 3.18 |
| Immigrants | Japan | 3.0 /100 | #241 | Tragic 3.18 |
| Hungarians | 3.0 /100 | #242 | Tragic 3.18 |
| Immigrants | Moldova | 2.9 /100 | #243 | Tragic 3.18 |
| Immigrants | Southern Europe | 2.9 /100 | #244 | Tragic 3.18 |
| Immigrants | Brazil | 2.7 /100 | #245 | Tragic 3.18 |
| Danes | 2.5 /100 | #246 | Tragic 3.17 |
Demographics Similar to Costa Ricans by Average Family Size
In terms of average family size, the demographic groups most similar to Costa Ricans are Immigrants from Venezuela (3.26, a difference of 0.020%), Immigrants from Western Asia (3.26, a difference of 0.040%), Laotian (3.26, a difference of 0.070%), African (3.25, a difference of 0.070%), and Immigrants from Hong Kong (3.26, a difference of 0.080%).
| Demographics | Rating | Rank | Average Family Size |
| Immigrants | Cuba | 91.3 /100 | #125 | Exceptional 3.26 |
| Immigrants | Costa Rica | 90.7 /100 | #126 | Exceptional 3.26 |
| Immigrants | Syria | 90.6 /100 | #127 | Exceptional 3.26 |
| Colombians | 89.9 /100 | #128 | Excellent 3.26 |
| Immigrants | Hong Kong | 88.6 /100 | #129 | Excellent 3.26 |
| Laotians | 88.5 /100 | #130 | Excellent 3.26 |
| Immigrants | Western Asia | 87.7 /100 | #131 | Excellent 3.26 |
| Costa Ricans | 86.8 /100 | #132 | Excellent 3.26 |
| Immigrants | Venezuela | 86.3 /100 | #133 | Excellent 3.26 |
| Africans | 84.9 /100 | #134 | Excellent 3.25 |
| Panamanians | 84.2 /100 | #135 | Excellent 3.25 |
| Comanche | 82.8 /100 | #136 | Excellent 3.25 |
| Immigrants | Middle Africa | 82.4 /100 | #137 | Excellent 3.25 |
| Cubans | 81.8 /100 | #138 | Excellent 3.25 |
| Immigrants | Ethiopia | 81.6 /100 | #139 | Excellent 3.25 |