Kenyan vs Costa Rican Average Family Size
COMPARE
Kenyan
Costa Rican
Average Family Size
Average Family Size Comparison
Kenyans
Costa Ricans
3.21
AVERAGE FAMILY SIZE
28.0/ 100
METRIC RATING
197th/ 347
METRIC RANK
3.26
AVERAGE FAMILY SIZE
86.8/ 100
METRIC RATING
132nd/ 347
METRIC RANK
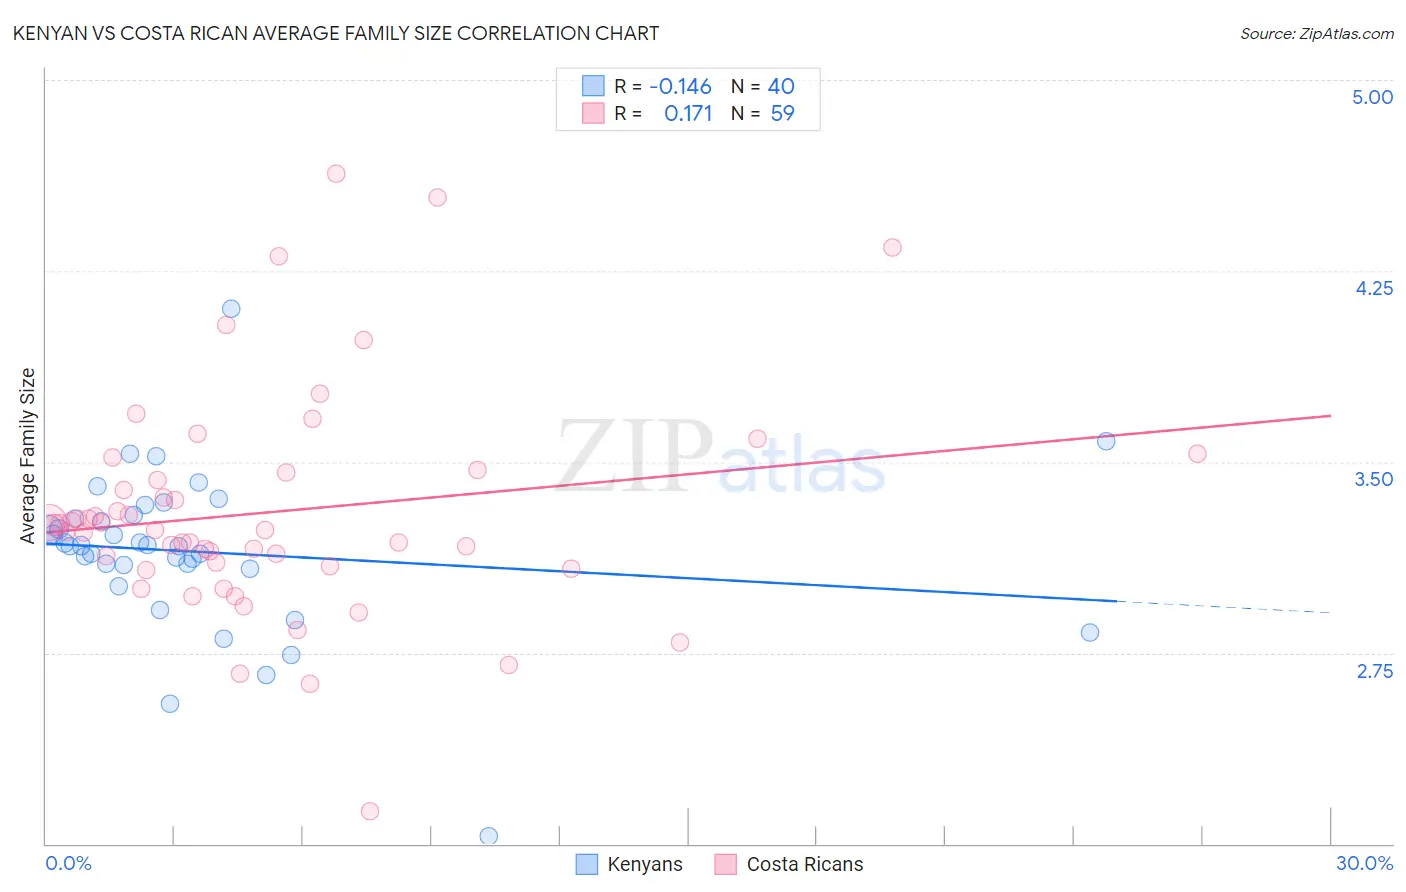
Kenyan vs Costa Rican Average Family Size Correlation Chart
The statistical analysis conducted on geographies consisting of 168,172,391 people shows a poor negative correlation between the proportion of Kenyans and average family size in the United States with a correlation coefficient (R) of -0.146 and weighted average of 3.21. Similarly, the statistical analysis conducted on geographies consisting of 253,470,463 people shows a poor positive correlation between the proportion of Costa Ricans and average family size in the United States with a correlation coefficient (R) of 0.171 and weighted average of 3.26, a difference of 1.3%.
Average Family Size Correlation Summary
| Measurement | Kenyan | Costa Rican |
| Minimum | 2.03 | 2.13 |
| Maximum | 4.10 | 4.63 |
| Range | 2.07 | 2.50 |
| Mean | 3.15 | 3.30 |
| Median | 3.17 | 3.23 |
| Interquartile 25% (IQ1) | 3.09 | 3.09 |
| Interquartile 75% (IQ3) | 3.28 | 3.46 |
| Interquartile Range (IQR) | 0.20 | 0.37 |
| Standard Deviation (Sample) | 0.32 | 0.44 |
| Standard Deviation (Population) | 0.32 | 0.44 |
Similar Demographics by Average Family Size
Demographics Similar to Kenyans by Average Family Size
In terms of average family size, the demographic groups most similar to Kenyans are Senegalese (3.21, a difference of 0.0%), Choctaw (3.21, a difference of 0.010%), Immigrants from Sudan (3.22, a difference of 0.020%), Immigrants from Israel (3.22, a difference of 0.030%), and Immigrants from Zaire (3.22, a difference of 0.050%).
| Demographics | Rating | Rank | Average Family Size |
| Burmese | 31.0 /100 | #190 | Fair 3.22 |
| Immigrants | Zaire | 30.5 /100 | #191 | Fair 3.22 |
| Immigrants | Eastern Africa | 30.1 /100 | #192 | Fair 3.22 |
| Immigrants | Israel | 29.3 /100 | #193 | Fair 3.22 |
| Immigrants | Sudan | 29.1 /100 | #194 | Fair 3.22 |
| Choctaw | 28.3 /100 | #195 | Fair 3.21 |
| Senegalese | 28.2 /100 | #196 | Fair 3.21 |
| Kenyans | 28.0 /100 | #197 | Fair 3.21 |
| Immigrants | Azores | 21.7 /100 | #198 | Fair 3.21 |
| Hmong | 20.7 /100 | #199 | Fair 3.21 |
| Immigrants | Kenya | 19.2 /100 | #200 | Poor 3.21 |
| Immigrants | Morocco | 18.5 /100 | #201 | Poor 3.21 |
| Immigrants | India | 18.5 /100 | #202 | Poor 3.21 |
| Immigrants | Nepal | 18.1 /100 | #203 | Poor 3.21 |
| Immigrants | Poland | 16.6 /100 | #204 | Poor 3.20 |
Demographics Similar to Costa Ricans by Average Family Size
In terms of average family size, the demographic groups most similar to Costa Ricans are Immigrants from Venezuela (3.26, a difference of 0.020%), Immigrants from Western Asia (3.26, a difference of 0.040%), Laotian (3.26, a difference of 0.070%), African (3.25, a difference of 0.070%), and Immigrants from Hong Kong (3.26, a difference of 0.080%).
| Demographics | Rating | Rank | Average Family Size |
| Immigrants | Cuba | 91.3 /100 | #125 | Exceptional 3.26 |
| Immigrants | Costa Rica | 90.7 /100 | #126 | Exceptional 3.26 |
| Immigrants | Syria | 90.6 /100 | #127 | Exceptional 3.26 |
| Colombians | 89.9 /100 | #128 | Excellent 3.26 |
| Immigrants | Hong Kong | 88.6 /100 | #129 | Excellent 3.26 |
| Laotians | 88.5 /100 | #130 | Excellent 3.26 |
| Immigrants | Western Asia | 87.7 /100 | #131 | Excellent 3.26 |
| Costa Ricans | 86.8 /100 | #132 | Excellent 3.26 |
| Immigrants | Venezuela | 86.3 /100 | #133 | Excellent 3.26 |
| Africans | 84.9 /100 | #134 | Excellent 3.25 |
| Panamanians | 84.2 /100 | #135 | Excellent 3.25 |
| Comanche | 82.8 /100 | #136 | Excellent 3.25 |
| Immigrants | Middle Africa | 82.4 /100 | #137 | Excellent 3.25 |
| Cubans | 81.8 /100 | #138 | Excellent 3.25 |
| Immigrants | Ethiopia | 81.6 /100 | #139 | Excellent 3.25 |