Celtic vs Japanese Family Households with Children
COMPARE
Celtic
Japanese
Family Households with Children
Family Households with Children Comparison
Celtics
Japanese
26.6%
FAMILY HOUSEHOLDS WITH CHILDREN
0.4/ 100
METRIC RATING
277th/ 347
METRIC RANK
29.4%
FAMILY HOUSEHOLDS WITH CHILDREN
100.0/ 100
METRIC RATING
31st/ 347
METRIC RANK
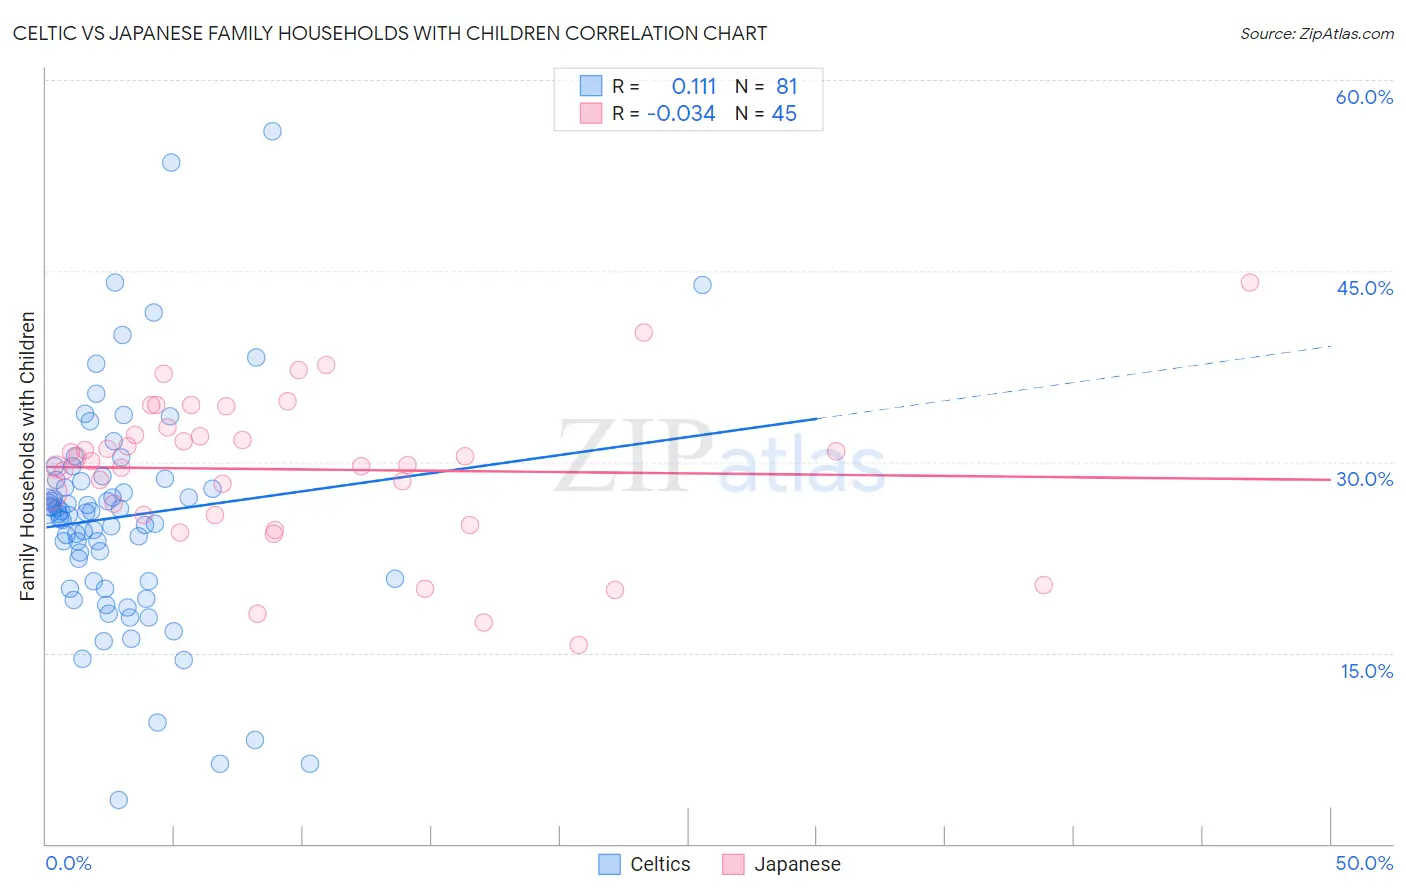
Celtic vs Japanese Family Households with Children Correlation Chart
The statistical analysis conducted on geographies consisting of 168,845,101 people shows a poor positive correlation between the proportion of Celtics and percentage of family households with children in the United States with a correlation coefficient (R) of 0.111 and weighted average of 26.6%. Similarly, the statistical analysis conducted on geographies consisting of 249,052,059 people shows no correlation between the proportion of Japanese and percentage of family households with children in the United States with a correlation coefficient (R) of -0.034 and weighted average of 29.4%, a difference of 10.6%.
Family Households with Children Correlation Summary
| Measurement | Celtic | Japanese |
| Minimum | 3.4% | 15.6% |
| Maximum | 55.9% | 44.0% |
| Range | 52.5% | 28.4% |
| Mean | 25.7% | 29.4% |
| Median | 26.1% | 30.1% |
| Interquartile 25% (IQ1) | 20.6% | 25.8% |
| Interquartile 75% (IQ3) | 28.7% | 32.4% |
| Interquartile Range (IQR) | 8.0% | 6.6% |
| Standard Deviation (Sample) | 9.0% | 5.9% |
| Standard Deviation (Population) | 9.0% | 5.9% |
Similar Demographics by Family Households with Children
Demographics Similar to Celtics by Family Households with Children
In terms of family households with children, the demographic groups most similar to Celtics are Immigrants from Europe (26.6%, a difference of 0.060%), Immigrants from Spain (26.6%, a difference of 0.080%), Finnish (26.6%, a difference of 0.080%), Senegalese (26.6%, a difference of 0.10%), and Immigrants from Northern Europe (26.7%, a difference of 0.11%).
| Demographics | Rating | Rank | Family Households with Children |
| Immigrants | Zaire | 0.7 /100 | #270 | Tragic 26.7% |
| French | 0.7 /100 | #271 | Tragic 26.7% |
| Somalis | 0.7 /100 | #272 | Tragic 26.7% |
| Immigrants | Hungary | 0.6 /100 | #273 | Tragic 26.7% |
| Eastern Europeans | 0.6 /100 | #274 | Tragic 26.7% |
| Immigrants | Northern Europe | 0.5 /100 | #275 | Tragic 26.7% |
| Immigrants | Spain | 0.5 /100 | #276 | Tragic 26.6% |
| Celtics | 0.4 /100 | #277 | Tragic 26.6% |
| Immigrants | Europe | 0.4 /100 | #278 | Tragic 26.6% |
| Finns | 0.4 /100 | #279 | Tragic 26.6% |
| Senegalese | 0.4 /100 | #280 | Tragic 26.6% |
| Lithuanians | 0.3 /100 | #281 | Tragic 26.6% |
| French American Indians | 0.3 /100 | #282 | Tragic 26.6% |
| Immigrants | North America | 0.3 /100 | #283 | Tragic 26.6% |
| Immigrants | Canada | 0.3 /100 | #284 | Tragic 26.5% |
Demographics Similar to Japanese by Family Households with Children
In terms of family households with children, the demographic groups most similar to Japanese are Immigrants from Yemen (29.4%, a difference of 0.060%), Yuman (29.5%, a difference of 0.14%), Samoan (29.5%, a difference of 0.18%), Bolivian (29.5%, a difference of 0.18%), and Venezuelan (29.4%, a difference of 0.26%).
| Demographics | Rating | Rank | Family Households with Children |
| Guamanians/Chamorros | 100.0 /100 | #24 | Exceptional 29.7% |
| Immigrants | Latin America | 100.0 /100 | #25 | Exceptional 29.7% |
| Sri Lankans | 100.0 /100 | #26 | Exceptional 29.5% |
| Immigrants | Vietnam | 100.0 /100 | #27 | Exceptional 29.5% |
| Samoans | 100.0 /100 | #28 | Exceptional 29.5% |
| Bolivians | 100.0 /100 | #29 | Exceptional 29.5% |
| Yuman | 100.0 /100 | #30 | Exceptional 29.5% |
| Japanese | 100.0 /100 | #31 | Exceptional 29.4% |
| Immigrants | Yemen | 100.0 /100 | #32 | Exceptional 29.4% |
| Venezuelans | 100.0 /100 | #33 | Exceptional 29.4% |
| Immigrants | Bolivia | 100.0 /100 | #34 | Exceptional 29.3% |
| Immigrants | Sierra Leone | 100.0 /100 | #35 | Exceptional 29.3% |
| Immigrants | Venezuela | 100.0 /100 | #36 | Exceptional 29.3% |
| Immigrants | Cameroon | 100.0 /100 | #37 | Exceptional 29.2% |
| Koreans | 100.0 /100 | #38 | Exceptional 29.2% |