Celtic vs Immigrants from Chile Family Households
COMPARE
Celtic
Immigrants from Chile
Family Households
Family Households Comparison
Celtics
Immigrants from Chile
63.8%
FAMILY HOUSEHOLDS
8.0/ 100
METRIC RATING
214th/ 347
METRIC RANK
64.6%
FAMILY HOUSEHOLDS
76.5/ 100
METRIC RATING
147th/ 347
METRIC RANK
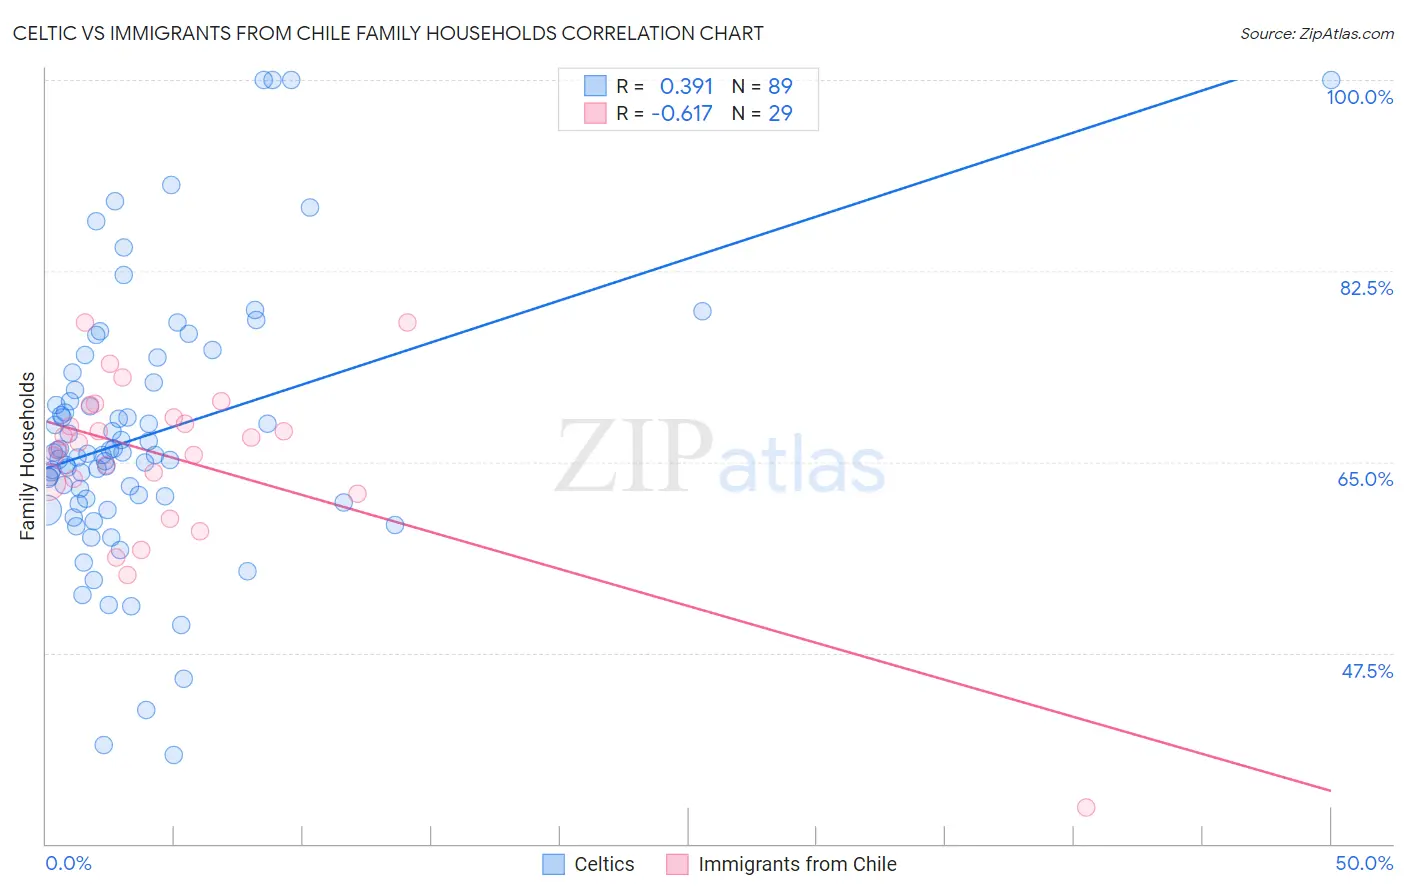
Celtic vs Immigrants from Chile Family Households Correlation Chart
The statistical analysis conducted on geographies consisting of 168,846,430 people shows a mild positive correlation between the proportion of Celtics and percentage of family households in the United States with a correlation coefficient (R) of 0.391 and weighted average of 63.8%. Similarly, the statistical analysis conducted on geographies consisting of 218,601,267 people shows a significant negative correlation between the proportion of Immigrants from Chile and percentage of family households in the United States with a correlation coefficient (R) of -0.617 and weighted average of 64.6%, a difference of 1.2%.
Family Households Correlation Summary
| Measurement | Celtic | Immigrants from Chile |
| Minimum | 38.1% | 33.3% |
| Maximum | 100.0% | 77.8% |
| Range | 61.9% | 44.5% |
| Mean | 67.4% | 65.2% |
| Median | 65.8% | 66.8% |
| Interquartile 25% (IQ1) | 61.4% | 62.6% |
| Interquartile 75% (IQ3) | 71.9% | 69.7% |
| Interquartile Range (IQR) | 10.5% | 7.0% |
| Standard Deviation (Sample) | 12.1% | 8.4% |
| Standard Deviation (Population) | 12.0% | 8.2% |
Similar Demographics by Family Households
Demographics Similar to Celtics by Family Households
In terms of family households, the demographic groups most similar to Celtics are Belgian (63.8%, a difference of 0.020%), Croatian (63.8%, a difference of 0.030%), Immigrants from Northern Europe (63.8%, a difference of 0.040%), Osage (63.7%, a difference of 0.050%), and Marshallese (63.7%, a difference of 0.050%).
| Demographics | Rating | Rank | Family Households |
| Nigerians | 11.5 /100 | #207 | Poor 63.9% |
| Immigrants | Bangladesh | 11.4 /100 | #208 | Poor 63.9% |
| Sierra Leoneans | 11.2 /100 | #209 | Poor 63.9% |
| Immigrants | Thailand | 9.6 /100 | #210 | Tragic 63.8% |
| Shoshone | 9.4 /100 | #211 | Tragic 63.8% |
| Immigrants | Netherlands | 9.4 /100 | #212 | Tragic 63.8% |
| Immigrants | Northern Europe | 8.8 /100 | #213 | Tragic 63.8% |
| Celtics | 8.0 /100 | #214 | Tragic 63.8% |
| Belgians | 7.6 /100 | #215 | Tragic 63.8% |
| Croatians | 7.3 /100 | #216 | Tragic 63.8% |
| Osage | 7.0 /100 | #217 | Tragic 63.7% |
| Marshallese | 6.9 /100 | #218 | Tragic 63.7% |
| Macedonians | 6.5 /100 | #219 | Tragic 63.7% |
| Immigrants | Europe | 6.4 /100 | #220 | Tragic 63.7% |
| Immigrants | South Africa | 5.9 /100 | #221 | Tragic 63.7% |
Demographics Similar to Immigrants from Chile by Family Households
In terms of family households, the demographic groups most similar to Immigrants from Chile are Delaware (64.6%, a difference of 0.0%), Sioux (64.6%, a difference of 0.0%), Immigrants from Romania (64.6%, a difference of 0.010%), Romanian (64.5%, a difference of 0.020%), and Syrian (64.5%, a difference of 0.020%).
| Demographics | Rating | Rank | Family Households |
| Immigrants | North Macedonia | 84.9 /100 | #140 | Excellent 64.7% |
| Immigrants | Cameroon | 84.8 /100 | #141 | Excellent 64.7% |
| Pakistanis | 84.0 /100 | #142 | Excellent 64.7% |
| Czechoslovakians | 82.1 /100 | #143 | Excellent 64.6% |
| South American Indians | 81.9 /100 | #144 | Excellent 64.6% |
| Welsh | 80.1 /100 | #145 | Excellent 64.6% |
| Immigrants | Romania | 77.0 /100 | #146 | Good 64.6% |
| Immigrants | Chile | 76.5 /100 | #147 | Good 64.6% |
| Delaware | 76.3 /100 | #148 | Good 64.6% |
| Sioux | 76.3 /100 | #149 | Good 64.6% |
| Romanians | 75.3 /100 | #150 | Good 64.5% |
| Syrians | 75.2 /100 | #151 | Good 64.5% |
| Scottish | 70.9 /100 | #152 | Good 64.5% |
| Swedes | 69.8 /100 | #153 | Good 64.5% |
| Austrians | 68.5 /100 | #154 | Good 64.5% |