Cape Verdean vs Immigrants from Sierra Leone Currently Married
COMPARE
Cape Verdean
Immigrants from Sierra Leone
Currently Married
Currently Married Comparison
Cape Verdeans
Immigrants from Sierra Leone
39.6%
CURRENTLY MARRIED
0.0/ 100
METRIC RATING
338th/ 347
METRIC RANK
43.8%
CURRENTLY MARRIED
0.1/ 100
METRIC RATING
259th/ 347
METRIC RANK
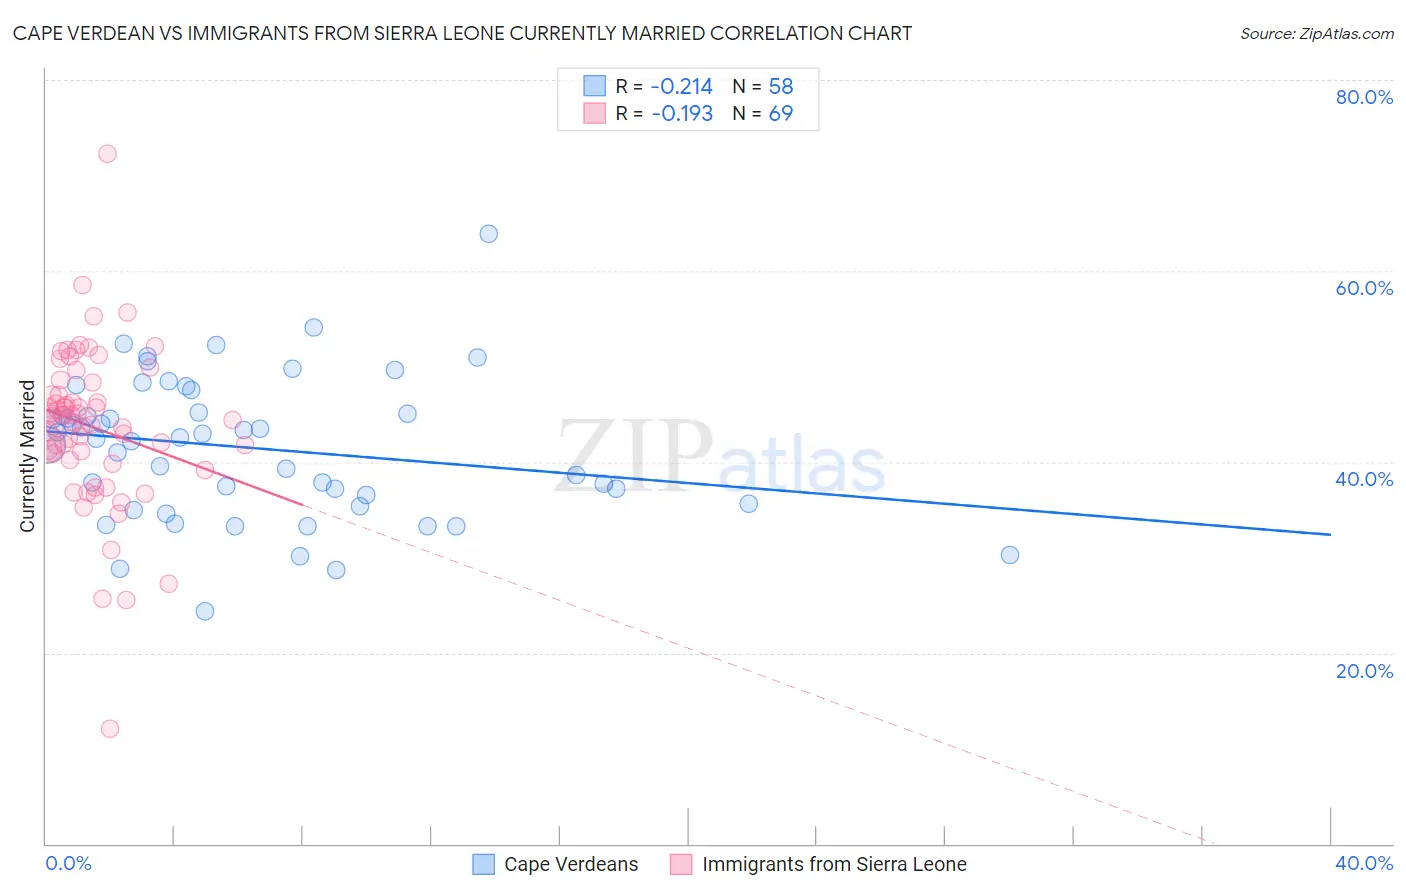
Cape Verdean vs Immigrants from Sierra Leone Currently Married Correlation Chart
The statistical analysis conducted on geographies consisting of 107,578,938 people shows a weak negative correlation between the proportion of Cape Verdeans and percentage of population currently married in the United States with a correlation coefficient (R) of -0.214 and weighted average of 39.6%. Similarly, the statistical analysis conducted on geographies consisting of 101,652,138 people shows a poor negative correlation between the proportion of Immigrants from Sierra Leone and percentage of population currently married in the United States with a correlation coefficient (R) of -0.193 and weighted average of 43.8%, a difference of 10.6%.
Currently Married Correlation Summary
| Measurement | Cape Verdean | Immigrants from Sierra Leone |
| Minimum | 24.4% | 12.0% |
| Maximum | 63.9% | 72.3% |
| Range | 39.5% | 60.3% |
| Mean | 41.5% | 43.7% |
| Median | 42.5% | 44.4% |
| Interquartile 25% (IQ1) | 35.6% | 40.5% |
| Interquartile 75% (IQ3) | 45.1% | 47.7% |
| Interquartile Range (IQR) | 9.5% | 7.1% |
| Standard Deviation (Sample) | 7.5% | 8.4% |
| Standard Deviation (Population) | 7.4% | 8.3% |
Similar Demographics by Currently Married
Demographics Similar to Cape Verdeans by Currently Married
In terms of currently married, the demographic groups most similar to Cape Verdeans are Black/African American (39.6%, a difference of 0.090%), Dominican (39.5%, a difference of 0.15%), British West Indian (39.8%, a difference of 0.47%), Lumbee (39.8%, a difference of 0.65%), and Puerto Rican (39.9%, a difference of 0.81%).
| Demographics | Rating | Rank | Currently Married |
| Immigrants | Barbados | 0.0 /100 | #331 | Tragic 40.3% |
| Immigrants | St. Vincent and the Grenadines | 0.0 /100 | #332 | Tragic 40.1% |
| Yup'ik | 0.0 /100 | #333 | Tragic 39.9% |
| Puerto Ricans | 0.0 /100 | #334 | Tragic 39.9% |
| Lumbee | 0.0 /100 | #335 | Tragic 39.8% |
| British West Indians | 0.0 /100 | #336 | Tragic 39.8% |
| Blacks/African Americans | 0.0 /100 | #337 | Tragic 39.6% |
| Cape Verdeans | 0.0 /100 | #338 | Tragic 39.6% |
| Dominicans | 0.0 /100 | #339 | Tragic 39.5% |
| Immigrants | Grenada | 0.0 /100 | #340 | Tragic 39.1% |
| Navajo | 0.0 /100 | #341 | Tragic 39.0% |
| Immigrants | Dominican Republic | 0.0 /100 | #342 | Tragic 38.9% |
| Pueblo | 0.0 /100 | #343 | Tragic 38.2% |
| Immigrants | Cabo Verde | 0.0 /100 | #344 | Tragic 37.8% |
| Tohono O'odham | 0.0 /100 | #345 | Tragic 36.8% |
Demographics Similar to Immigrants from Sierra Leone by Currently Married
In terms of currently married, the demographic groups most similar to Immigrants from Sierra Leone are Immigrants from Latin America (43.8%, a difference of 0.060%), Immigrants from Nicaragua (43.7%, a difference of 0.11%), Ute (43.9%, a difference of 0.21%), Immigrants from Africa (43.9%, a difference of 0.22%), and Bangladeshi (43.7%, a difference of 0.25%).
| Demographics | Rating | Rank | Currently Married |
| Hispanics or Latinos | 0.3 /100 | #252 | Tragic 44.1% |
| Immigrants | Central America | 0.3 /100 | #253 | Tragic 44.1% |
| Vietnamese | 0.2 /100 | #254 | Tragic 44.0% |
| Yakama | 0.2 /100 | #255 | Tragic 44.0% |
| Shoshone | 0.2 /100 | #256 | Tragic 44.0% |
| Immigrants | Africa | 0.2 /100 | #257 | Tragic 43.9% |
| Ute | 0.2 /100 | #258 | Tragic 43.9% |
| Immigrants | Sierra Leone | 0.1 /100 | #259 | Tragic 43.8% |
| Immigrants | Latin America | 0.1 /100 | #260 | Tragic 43.8% |
| Immigrants | Nicaragua | 0.1 /100 | #261 | Tragic 43.7% |
| Bangladeshis | 0.1 /100 | #262 | Tragic 43.7% |
| Immigrants | Cuba | 0.1 /100 | #263 | Tragic 43.7% |
| Sudanese | 0.1 /100 | #264 | Tragic 43.7% |
| Immigrants | Bangladesh | 0.1 /100 | #265 | Tragic 43.6% |
| Ecuadorians | 0.1 /100 | #266 | Tragic 43.6% |