Cape Verdean vs Immigrants from Hungary Currently Married
COMPARE
Cape Verdean
Immigrants from Hungary
Currently Married
Currently Married Comparison
Cape Verdeans
Immigrants from Hungary
39.6%
CURRENTLY MARRIED
0.0/ 100
METRIC RATING
338th/ 347
METRIC RANK
47.6%
CURRENTLY MARRIED
91.2/ 100
METRIC RATING
111th/ 347
METRIC RANK
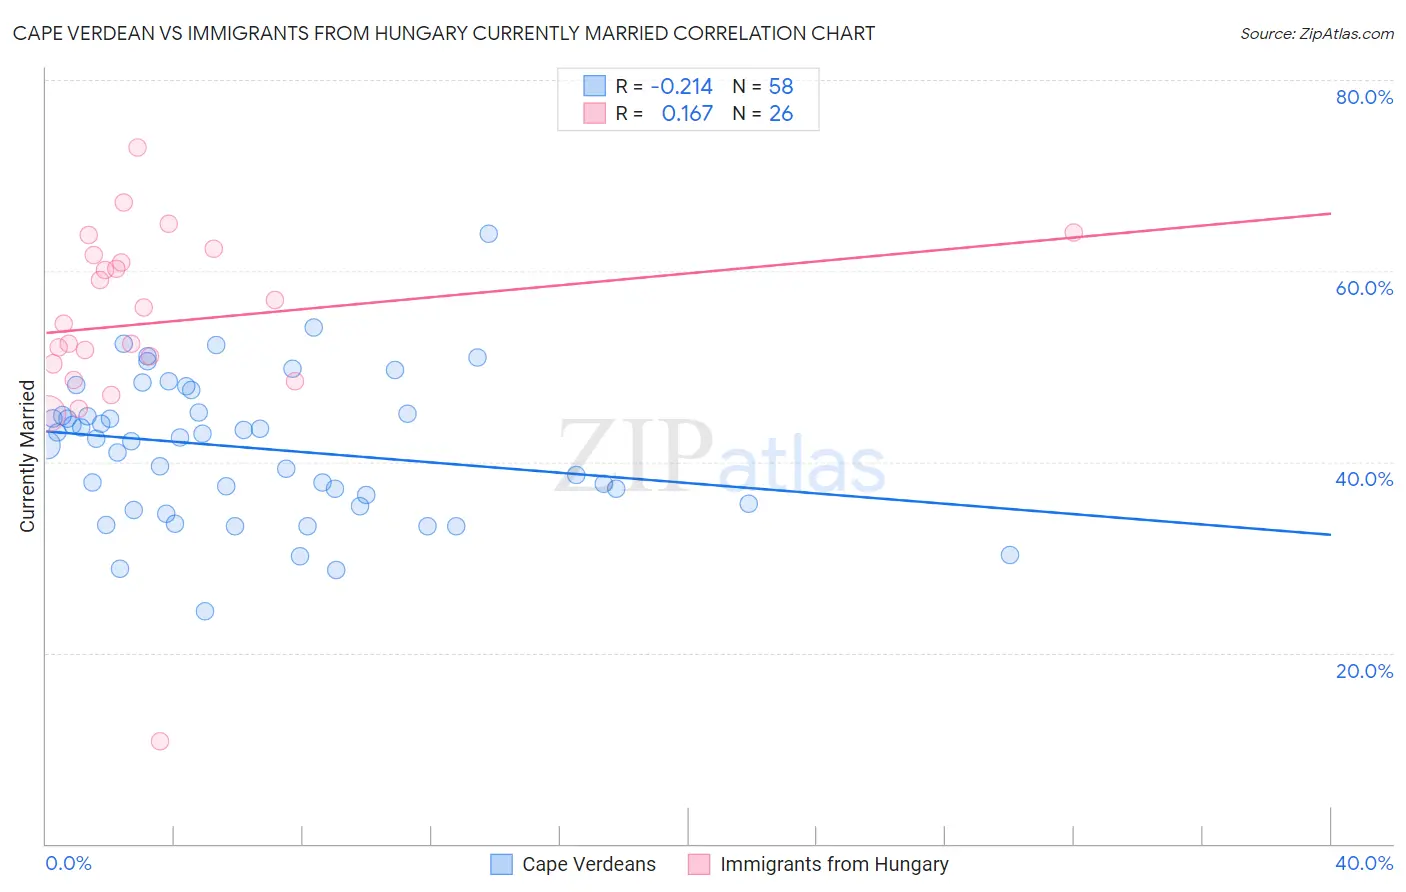
Cape Verdean vs Immigrants from Hungary Currently Married Correlation Chart
The statistical analysis conducted on geographies consisting of 107,578,938 people shows a weak negative correlation between the proportion of Cape Verdeans and percentage of population currently married in the United States with a correlation coefficient (R) of -0.214 and weighted average of 39.6%. Similarly, the statistical analysis conducted on geographies consisting of 195,704,410 people shows a poor positive correlation between the proportion of Immigrants from Hungary and percentage of population currently married in the United States with a correlation coefficient (R) of 0.167 and weighted average of 47.6%, a difference of 20.3%.
Currently Married Correlation Summary
| Measurement | Cape Verdean | Immigrants from Hungary |
| Minimum | 24.4% | 10.7% |
| Maximum | 63.9% | 72.9% |
| Range | 39.5% | 62.2% |
| Mean | 41.5% | 54.6% |
| Median | 42.5% | 55.3% |
| Interquartile 25% (IQ1) | 35.6% | 50.3% |
| Interquartile 75% (IQ3) | 45.1% | 61.7% |
| Interquartile Range (IQR) | 9.5% | 11.4% |
| Standard Deviation (Sample) | 7.5% | 11.5% |
| Standard Deviation (Population) | 7.4% | 11.3% |
Similar Demographics by Currently Married
Demographics Similar to Cape Verdeans by Currently Married
In terms of currently married, the demographic groups most similar to Cape Verdeans are Black/African American (39.6%, a difference of 0.090%), Dominican (39.5%, a difference of 0.15%), British West Indian (39.8%, a difference of 0.47%), Lumbee (39.8%, a difference of 0.65%), and Puerto Rican (39.9%, a difference of 0.81%).
| Demographics | Rating | Rank | Currently Married |
| Immigrants | Barbados | 0.0 /100 | #331 | Tragic 40.3% |
| Immigrants | St. Vincent and the Grenadines | 0.0 /100 | #332 | Tragic 40.1% |
| Yup'ik | 0.0 /100 | #333 | Tragic 39.9% |
| Puerto Ricans | 0.0 /100 | #334 | Tragic 39.9% |
| Lumbee | 0.0 /100 | #335 | Tragic 39.8% |
| British West Indians | 0.0 /100 | #336 | Tragic 39.8% |
| Blacks/African Americans | 0.0 /100 | #337 | Tragic 39.6% |
| Cape Verdeans | 0.0 /100 | #338 | Tragic 39.6% |
| Dominicans | 0.0 /100 | #339 | Tragic 39.5% |
| Immigrants | Grenada | 0.0 /100 | #340 | Tragic 39.1% |
| Navajo | 0.0 /100 | #341 | Tragic 39.0% |
| Immigrants | Dominican Republic | 0.0 /100 | #342 | Tragic 38.9% |
| Pueblo | 0.0 /100 | #343 | Tragic 38.2% |
| Immigrants | Cabo Verde | 0.0 /100 | #344 | Tragic 37.8% |
| Tohono O'odham | 0.0 /100 | #345 | Tragic 36.8% |
Demographics Similar to Immigrants from Hungary by Currently Married
In terms of currently married, the demographic groups most similar to Immigrants from Hungary are Immigrants from Western Europe (47.6%, a difference of 0.010%), Immigrants from Denmark (47.6%, a difference of 0.040%), South African (47.6%, a difference of 0.070%), Immigrants from Indonesia (47.6%, a difference of 0.070%), and Palestinian (47.6%, a difference of 0.080%).
| Demographics | Rating | Rank | Currently Married |
| Serbians | 93.6 /100 | #104 | Exceptional 47.8% |
| Immigrants | Singapore | 93.3 /100 | #105 | Exceptional 47.8% |
| Immigrants | Greece | 93.1 /100 | #106 | Exceptional 47.7% |
| Immigrants | Italy | 92.9 /100 | #107 | Exceptional 47.7% |
| Tsimshian | 92.4 /100 | #108 | Exceptional 47.7% |
| Immigrants | Egypt | 92.3 /100 | #109 | Exceptional 47.7% |
| Immigrants | Russia | 92.0 /100 | #110 | Exceptional 47.7% |
| Immigrants | Hungary | 91.2 /100 | #111 | Exceptional 47.6% |
| Immigrants | Western Europe | 91.1 /100 | #112 | Exceptional 47.6% |
| Immigrants | Denmark | 90.9 /100 | #113 | Exceptional 47.6% |
| South Africans | 90.5 /100 | #114 | Exceptional 47.6% |
| Immigrants | Indonesia | 90.5 /100 | #115 | Exceptional 47.6% |
| Palestinians | 90.4 /100 | #116 | Exceptional 47.6% |
| Puget Sound Salish | 90.3 /100 | #117 | Exceptional 47.6% |
| Immigrants | Philippines | 90.2 /100 | #118 | Exceptional 47.6% |