Cape Verdean vs Immigrants from Eastern Africa Currently Married
COMPARE
Cape Verdean
Immigrants from Eastern Africa
Currently Married
Currently Married Comparison
Cape Verdeans
Immigrants from Eastern Africa
39.6%
CURRENTLY MARRIED
0.0/ 100
METRIC RATING
338th/ 347
METRIC RANK
44.2%
CURRENTLY MARRIED
0.3/ 100
METRIC RATING
250th/ 347
METRIC RANK
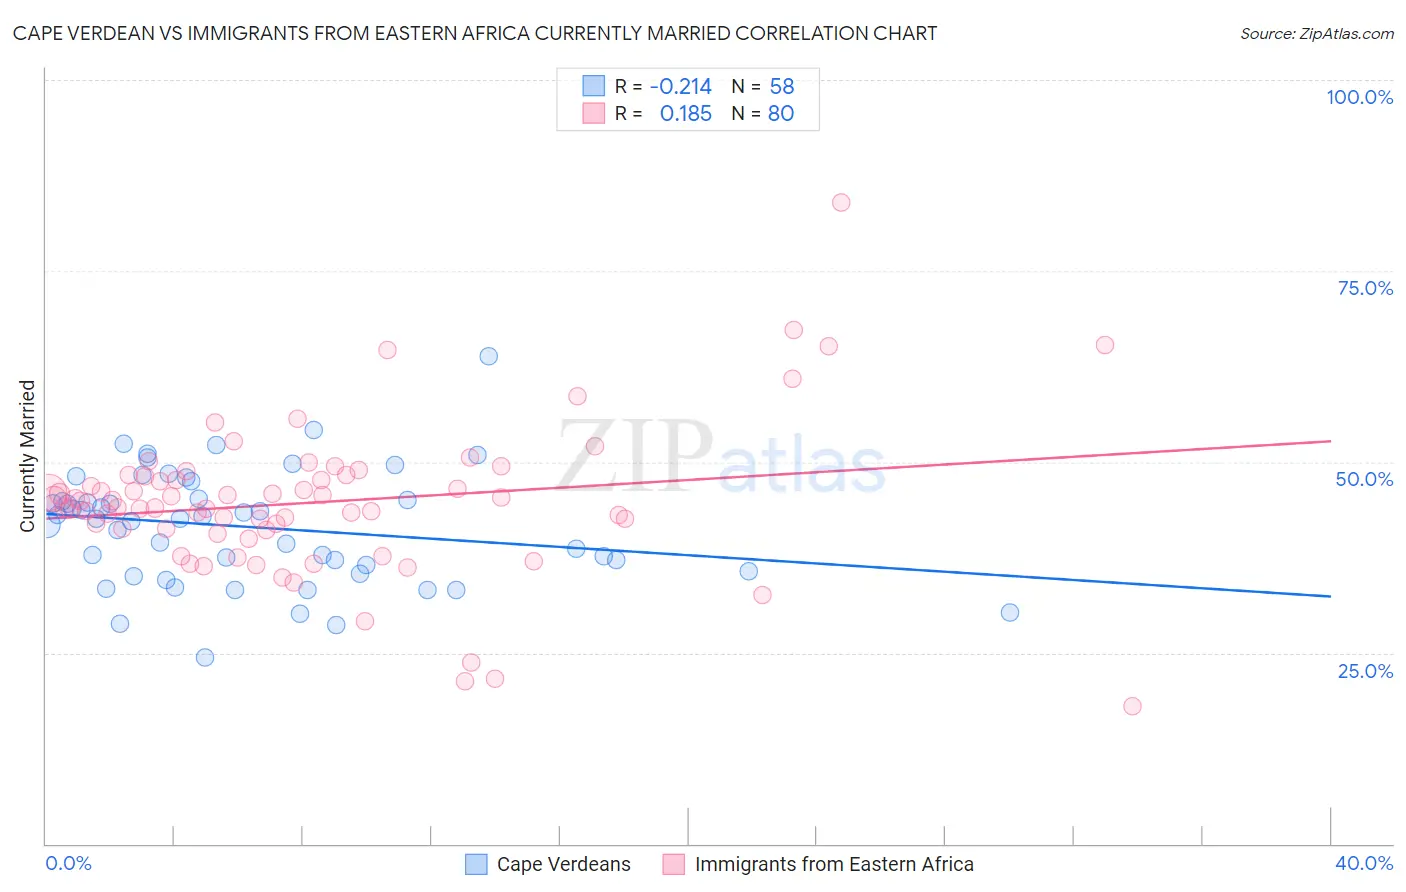
Cape Verdean vs Immigrants from Eastern Africa Currently Married Correlation Chart
The statistical analysis conducted on geographies consisting of 107,578,938 people shows a weak negative correlation between the proportion of Cape Verdeans and percentage of population currently married in the United States with a correlation coefficient (R) of -0.214 and weighted average of 39.6%. Similarly, the statistical analysis conducted on geographies consisting of 355,130,503 people shows a poor positive correlation between the proportion of Immigrants from Eastern Africa and percentage of population currently married in the United States with a correlation coefficient (R) of 0.185 and weighted average of 44.2%, a difference of 11.6%.
Currently Married Correlation Summary
| Measurement | Cape Verdean | Immigrants from Eastern Africa |
| Minimum | 24.4% | 18.0% |
| Maximum | 63.9% | 83.9% |
| Range | 39.5% | 65.9% |
| Mean | 41.5% | 44.7% |
| Median | 42.5% | 44.4% |
| Interquartile 25% (IQ1) | 35.6% | 41.2% |
| Interquartile 75% (IQ3) | 45.1% | 48.2% |
| Interquartile Range (IQR) | 9.5% | 7.0% |
| Standard Deviation (Sample) | 7.5% | 10.0% |
| Standard Deviation (Population) | 7.4% | 9.9% |
Similar Demographics by Currently Married
Demographics Similar to Cape Verdeans by Currently Married
In terms of currently married, the demographic groups most similar to Cape Verdeans are Black/African American (39.6%, a difference of 0.090%), Dominican (39.5%, a difference of 0.15%), British West Indian (39.8%, a difference of 0.47%), Lumbee (39.8%, a difference of 0.65%), and Puerto Rican (39.9%, a difference of 0.81%).
| Demographics | Rating | Rank | Currently Married |
| Immigrants | Barbados | 0.0 /100 | #331 | Tragic 40.3% |
| Immigrants | St. Vincent and the Grenadines | 0.0 /100 | #332 | Tragic 40.1% |
| Yup'ik | 0.0 /100 | #333 | Tragic 39.9% |
| Puerto Ricans | 0.0 /100 | #334 | Tragic 39.9% |
| Lumbee | 0.0 /100 | #335 | Tragic 39.8% |
| British West Indians | 0.0 /100 | #336 | Tragic 39.8% |
| Blacks/African Americans | 0.0 /100 | #337 | Tragic 39.6% |
| Cape Verdeans | 0.0 /100 | #338 | Tragic 39.6% |
| Dominicans | 0.0 /100 | #339 | Tragic 39.5% |
| Immigrants | Grenada | 0.0 /100 | #340 | Tragic 39.1% |
| Navajo | 0.0 /100 | #341 | Tragic 39.0% |
| Immigrants | Dominican Republic | 0.0 /100 | #342 | Tragic 38.9% |
| Pueblo | 0.0 /100 | #343 | Tragic 38.2% |
| Immigrants | Cabo Verde | 0.0 /100 | #344 | Tragic 37.8% |
| Tohono O'odham | 0.0 /100 | #345 | Tragic 36.8% |
Demographics Similar to Immigrants from Eastern Africa by Currently Married
In terms of currently married, the demographic groups most similar to Immigrants from Eastern Africa are Immigrants from Cameroon (44.2%, a difference of 0.020%), Nicaraguan (44.2%, a difference of 0.040%), Blackfeet (44.2%, a difference of 0.060%), Hispanic or Latino (44.1%, a difference of 0.080%), and Ugandan (44.2%, a difference of 0.12%).
| Demographics | Rating | Rank | Currently Married |
| Immigrants | Ethiopia | 0.7 /100 | #243 | Tragic 44.5% |
| Japanese | 0.6 /100 | #244 | Tragic 44.5% |
| Immigrants | Armenia | 0.4 /100 | #245 | Tragic 44.3% |
| Immigrants | Burma/Myanmar | 0.4 /100 | #246 | Tragic 44.3% |
| Ugandans | 0.4 /100 | #247 | Tragic 44.2% |
| Nicaraguans | 0.3 /100 | #248 | Tragic 44.2% |
| Immigrants | Cameroon | 0.3 /100 | #249 | Tragic 44.2% |
| Immigrants | Eastern Africa | 0.3 /100 | #250 | Tragic 44.2% |
| Blackfeet | 0.3 /100 | #251 | Tragic 44.2% |
| Hispanics or Latinos | 0.3 /100 | #252 | Tragic 44.1% |
| Immigrants | Central America | 0.3 /100 | #253 | Tragic 44.1% |
| Vietnamese | 0.2 /100 | #254 | Tragic 44.0% |
| Yakama | 0.2 /100 | #255 | Tragic 44.0% |
| Shoshone | 0.2 /100 | #256 | Tragic 44.0% |
| Immigrants | Africa | 0.2 /100 | #257 | Tragic 43.9% |